canada an oasis of stability
play

Canada An Oasis of Stability First Quarter - 2012 Office 8.0% - PowerPoint PPT Presentation

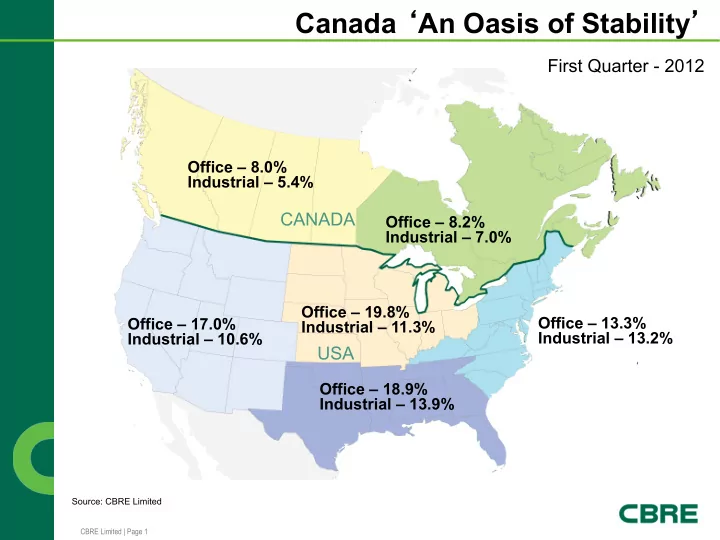
Canada An Oasis of Stability First Quarter - 2012 Office 8.0% Industrial 5.4% CANADA Office 8.2% Industrial 7.0% Office 19.8% Office 13.3% Office 17.0% Industrial 11.3% Industrial 13.2%


  1. Canada ‘ An Oasis of Stability ’ First Quarter - 2012 Office – 8.0% Industrial – 5.4% CANADA Office – 8.2% Industrial – 7.0% Office – 19.8% Office – 13.3% Office – 17.0% Industrial – 11.3% Industrial – 13.2% Industrial – 10.6% USA Office – 18.9% Industrial – 13.9% Source: CBRE Limited CBRE Limited | Page 1

  2. Vacancy Moving Down from Cyclic Highs Vacancy improving in all sectors except retail Vacancy and Availability Rates Previous Peak Year Back to “ Natural Peak/Year 2011Q4 "Natural Rate" Year Rate ” Office 16.9 / 2010 19.6 / 1991 13 to14 2014 16.0 Industrial 11.9 / 2004 9 to 10 2015 13.6 14.5 / 2010 13.2 13.2 / 2011 Retail 11.3 / 1992 9 to 10 2017 5.2 7.4 / 2009 6.8 / 2003 5 to 6 2011 Multifamily 37.9 42.5 / 2002 32 to 34 44.5 / 2009 2012 Hotels Sources: CBRE-EA 2011Q4 Outlook Report CBRE Limited | Page 2

  3. Bell Tower CBRE Limited | Page 3

  4. Bell Tower and Oxford Tower CBRE Limited | Page 4

  5. Oxford Tower CBRE Limited | Page 5

  6. 1630 Prospect Place CBRE Limited | Page 6

  7. 1614 Prospect Place CBRE Limited | Page 7

  8. Northwest Business Park (NWBP) CBRE Limited | Page 8

  9. Moving Towards Undersupplied Source: CBRE-EA Canada Outlook 4Q 2011 CBRE Limited | Page 9

  10. Office Towers In The Pipeline Source: CBRE Limited CBRE Limited | Page 10

  11. Industrial Space In The Pipeline Source: CBRE Limited CBRE Limited | Page 11

  12. Calgary NEW DOWNTOWN OFFICE DEVELOPMENTS 2014 - 2016 Hines Oxford Cadillac Fairview Brookfield Matthews Development 2015: Eau Claire 2016: Calgary 2017: Herald Site 2014: 8 th Ave. Pl. 2016: Bow South Tower City Centre – west tower 841,000 SF 600,000 SF 820,000 SF 1,200,000 SF 400,000 SF Permitting/ Permitting/ Permitting/ Permitting/ U/C 2014 Preleasing 2015 Preleasing 2016 Preleasing Preleasing 2017 Completion Completion Completion 2016 Completion Completion CBRE Limited | Page 12

  13. Vancouver NEW DOWNTOWN OFFICE DEVELOPMENTS 2014 - 2016 Oxford Properties Bentall Kennedy TELUS/Westbank Credit Suisse/Swissreal Manulife Pattison/Reliance 2014: MNP Tower 2015: 745 Thurlow Street 2015: TELUS Gardens 2015: The Exchange 2015-2016: 980 Howe 2015-2016: Burrard Gateway 270,000 SF 365,000 SF 448,000 SF 400,000 SF 270,000 SF 204,000 SF Under Construction Under Construction Under Construction Permitting/Preleasing Permitting/Preleasing Permitting/Preleasing 2014 Completion 2015 Completion 2015 Completion 2015 Completion CBRE Limited | Page 13

  14. Canadian Investment Transactions ($B) Market 2007 2008 2009 2010 2011 Vancouver $3.6 $2.9 $2.9 $3.1 $3.4 Calgary $6.0 $3.8 $1.4 $1.6 $2.5 Edmonton $2.8 $2.2 $1.2 $2.0 $2.4 Toronto $10.9 $7.3 $3.9 $7.6 $9.6 Ottawa $2.1 $0.7 $0.9 $1.0 $0.9 Montreal $4.7 $3.5 $1.9 $3.0 $3.4 Halifax $0.5 $0.2 $0.1 $0.3 $0.5 National $32.1 $21.7 $13.0 $19.5 $23.6 Source: CBRE Limited/RealNet Canada CBRE Limited | Page 14

  15. 2011 National Investment Sales Approach 2004 Levels APARTMENT HOTEL INDUSTRIAL OFFICE RETAIL TOTAL %CHANGE 2003 $30.0 $1.2 $14.3 $46.7 $28.8 $120.9 - $46.4 $58.1 $35.4 $181.0 2004 $51.4 $16.6 $21.8 $76.1 $50.4 $216.3 78.9% $17.0 $24.3 2005 $92.1 $28.6 $39.7 $109.1 $51.9 $321.3 48.5% 2006 $90.0 $36.5 $45.0 $141.3 $51.3 $364.1 13.3% 2007 $96.6 $62.0 $51.9 $209.2 $65.0 $484.7 33.1% 2008 $39.4 $11.9 $23.5 $57.7 $20.8 $153.3 -68.4% 2009 $16.5 $3.3 $10.1 $18.0 $12.2 $60.2 -60.8% 2010 $34.2 $12.7 $17.7 $44.8 $19.7 $129.2 114.7% 2011 $46.4 $17.0 $24.3 $58.1 $35.4 $181.0 40.1% 2011 TOTALS Source: Real Capital Analytics *2011 Unaudited, figures in Billions. CBRE Limited | Page 15

  16. Canadian Cross-Border Capital in the U.S. Total Total Market Country Total Props Total Volume Props Volume Canada 935 $30,788.6 Manhattan 12 $5,632.0 *Volume in Millions of $ Boston 26 $3,215.0 Los 16 $2,795.8 Angeles San Diego 13 $1,726.1 Houston 40 $1,681.0 Phoenix 80 $1,054.2 DC 7 $969.5 No NJ 11 $884.6 San Jose 8 $829.2 Other 722 $12,001.2 Total 935 $30,788.6 *Volume in millions of $ Sources: Real Capital Analytics, Properties over $2.5 million tracked since 2007. Updated 2.21.12. CBRE Limited | Page 16

  17. Cap Rate Compression Not Going Away Crazy! Sane? Source: CBRE Limited CBRE Limited | Page 17

  18. Cap and Interest Rates Linked Source: CBRE Limited, Bank of Canada CBRE Limited | Page 18

  19. Lack of Interest Source: Bank of Canada CBRE Limited | Page 19

  20. National Cap Rate vs. 10-yr Bond Yield Source: CBRE Limited, Bank of Canada CBRE Limited | Page 20

  21. Comparing Institutional Performance Source: Yahoo! Finance CBRE Limited | Page 21

Download Presentation
Download Policy: The content available on the website is offered to you 'AS IS' for your personal information and use only. It cannot be commercialized, licensed, or distributed on other websites without prior consent from the author. To download a presentation, simply click this link. If you encounter any difficulties during the download process, it's possible that the publisher has removed the file from their server.

Recommend


More recommend