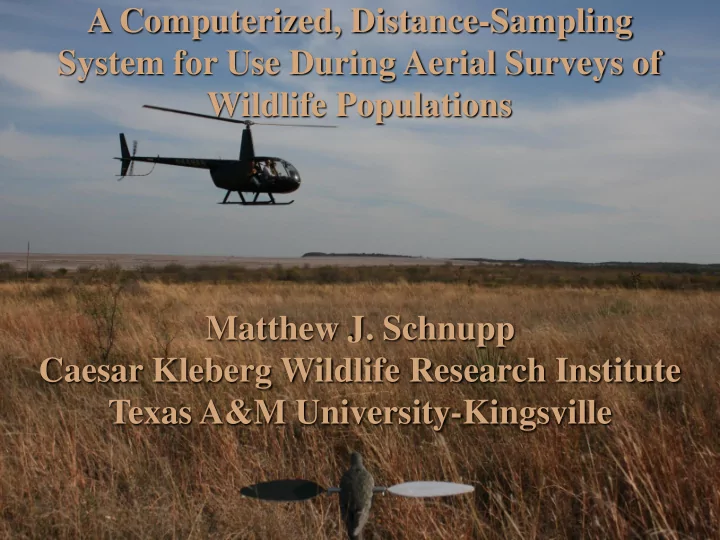

A Computerized, Distance-Sampling System for Use During Aerial Surveys of Wildlife Populations Matthew J. Schnupp Caesar Kleberg Wildlife Research Institute Texas A&M University-Kingsville
Introduction • Estimation of wildlife abundance is an important aspect of wildlife conservation and management • Distance sampling is a recommended technique for estimating wildlife abundance but requires a large number of detections • Distance sampling with helicopter surveys has been used to estimate ungulates, carnivores, and Galliformes
Distance Sampling • Distance sampling involves traversing a linear transect and measuring perpendicular distances to observations • Major assumptions are: distances are measured accurately observations directly on the transect are detected no movement of animals prior to detection • Using distance sampling with helicopter surveys introduces unique challenges
Objectives I. Develop an electronic system that could be used to collect distance-sampling data during helicopter surveys to provide: instantaneous guidance accurate distances & transect length record of cluster size II. To evaluate the precision and accuracy of the system in a: a) Controlled test b) Mock survey in the field c) Actual field surveys of northern bobwhite
Study Area Control Test TAMUK, Kleberg County Field Tests Rolling Plains (RPQRR, Fisher County) South Texas Plains (King Ranch, Kenedy & Kleberg Counties)
Methods
Methods Objective I. System Development Modified System for Electronic Surveys (MSES) 2 tablet personal computers (PCs) 1 Raven Cruizer lightbar and DGPS 2 MDL LaserAce 300 Laser rangefinders 2 custom 17-key keypads Custom ArcPAD Applet
MSES • System weight: 3.5 kg • Assembly time: 5 – 10 min • Data Processing: 1 – 2 hrs • Original Cost: $16,445.00 • Current Cost: $ 6,399.00
Methods PRE-encounter Pilot Guidance System Control Observer Guidance
Methods POST-encounter
Methods
Methods Objective IIa. Accuracy & Precision ( Control Test ) • A controlled test was conducted from a building rooftop (10m) to test the accuracy of the system in the absence of rotor turbulence and human error • Eight targets were painted on the ground below the building at 10-m intervals extending to 130 m • The laser rangefinder was fired (10 /target) from a tripod
Methods Objective IIb. Accuracy & Precision ( Mock Survey ) • A mock field trial was conducted in an agricultural field to test the accuracy of the system in the presence of rotor turbulence and human error • Helicopter flights ( n = 3 obs/flight) occurred along a 3-km transect containing 16 targets • Targets were distributed within 10-m intervals from 10 – 70m
Methods Objective IIc. Field Evaluation ( Case Study ) Used MSES during actual field surveys to estimate northern bobwhite during Dec-Jan 2008-09: 18 pastures in Norias and Santa Gertrudis Divisions of King Ranch ranging in area from 1,705 to 3,327 ha. (42,242 ha.) 8-10 transects/pasture (80 total) were designed using ArcMap 9.3 and were spaced 600 m apart Average survey effort was 40 km/pasture (total effort = 707 km)
Statistical Analyses Accuracy & Precision • Calculated Euclidean-distance error Target No error would indicate complete overlap • Regressed estimated distance Electronic estimation versus actual distance using location SAS 9.1 No error would be indicated by a slope = 1 Transect and r 2 = 1
Statistical Analyses Density Estimation • Program DISTANCE 6.0 was used to estimate bobwhite density • Evaluated detection function models Half-normal + cosine Uniform + cosine • Evaluated density estimates 95% Confidence Intervals Coefficient of Variation (CV)
Results
Results Table 1. Euclidean distance error (m) of MSES during a controlled test and field test, Kleberg County and Fisher County, 2007 Test Error SE Controlled Test 1.77 0.12 Field Test 5.55 1.33
Results Figure 1. Linear regression of estimated distance and actual distance using MSES during a controlled test, Kleberg County, 2007 140 Estimated distance (m) 120 100 80 60 40 y = 1.001x - 1.514 20 r² = 0.99 0 0 20 40 60 80 100 120 Actual distance (m)
Results Figure 2. Linear regression of estimated distance and actual distance using MSES during a field test, Fisher County, 2007 70 Estimated distance (m) 60 50 40 30 20 y = 0.987x + 0.259 10 r² = 0.98 0 0 10 20 30 40 50 60 70 Actual distance (m) Actual distance (m)
Results Figure 3. Histogram of perpendicular distances obtained during northern-bobwhite surveys (n = 313 detections), Kenedy & Kleberg Counties, 2008 – 2009 Detection Probability Perpendicular distance in meters
Results Table 2. Northern bobwhite density (no/ha) estimated using helicopter-based distance sampling and MSES, Kenedy & Kleberg Counties, 2008 – 2009 Site D 95% CI CV(D) n Santa Gertrudis 86 0.13 0.09 0.19 18.23 East-Norias 72 0.12 0.08 0.19 20.03 West-Norias 155 0.11 0.09 0.14 12.11 Pooled 313 0.12 0.10 0.15 9.52
Conclusions
Conclusions • MSES was a practical electronic system that could be used with distance sampling during helicopter surveys • MSES provided accurate and precise distances in a controlled setting and field evaluation • MSES produced precise estimates of northern bobwhite density
Management Implications • Methods used for aerial surveys prior to the MSES: Angle of declination Visual estimation (Strut Marker System) Geographical position (Leave the Transect) • These options can be biased, inaccurate, and tedious
Management Implications • MSES addresses prior limitations of using distance sampling with aerial surveys (i.e., navigating a centerline, accurate perpendicular distance estimation, geo-referenced encounter locations) • MSES is a promising system for estimating density of terrestrial species in which aerial-based distance sampling is appropriate • MSES merges the reliability and benefits of distance sampling with the efficiency of helicopter surveys to achieve accurate and precise results
Acknowledgments • Fidel Hernandez, Steve DeMaso, Lenny Brennan, Fred Bryant, Dale Rollins, Robert Perez, and Eric Redeker • Joseph Sands and Trent Teinert • King Ranch, Inc. • Rolling Plains Quail Research Ranch • Texas Parks and Wildlife Department • Quail Associates • Texas Quail Coalition • Hamman, Kleberg, McNutt, and Smith Foundation
Recommend
More recommend