Buying Traffic Decongestion by Paying Drivers to Become Passengers - - PDF document

buying traffic decongestion by paying drivers to become
SMART_READER_LITE
LIVE PREVIEW

Buying Traffic Decongestion by Paying Drivers to Become Passengers - - PDF document

2/2/2020 Buying Traffic Decongestion by Paying Drivers to Become Passengers TRB 2020 Annual Meeting | Lectern Session 13917 Paul Minett , Trip Convergence Ltd, Auckland, New Zealand (PI) John Niles , Global Telematics, Seattle, Washington, USA


slide-1
SLIDE 1

2/2/2020 1

Buying Traffic Decongestion by Paying Drivers to Become Passengers

Paul Minett, Trip Convergence Ltd, Auckland, New Zealand (PI) John Niles, Global Telematics, Seattle, Washington, USA Richard Lee, San Jose State University, San Jose, California, USA Brittany Bogue, San Jose State University, San Jose, California, USA Research project of Mineta Transportation Institute, transweb.sjsu.edu Funded by the United States Department of Transportation TRB 2020 Annual Meeting | Lectern Session 13917

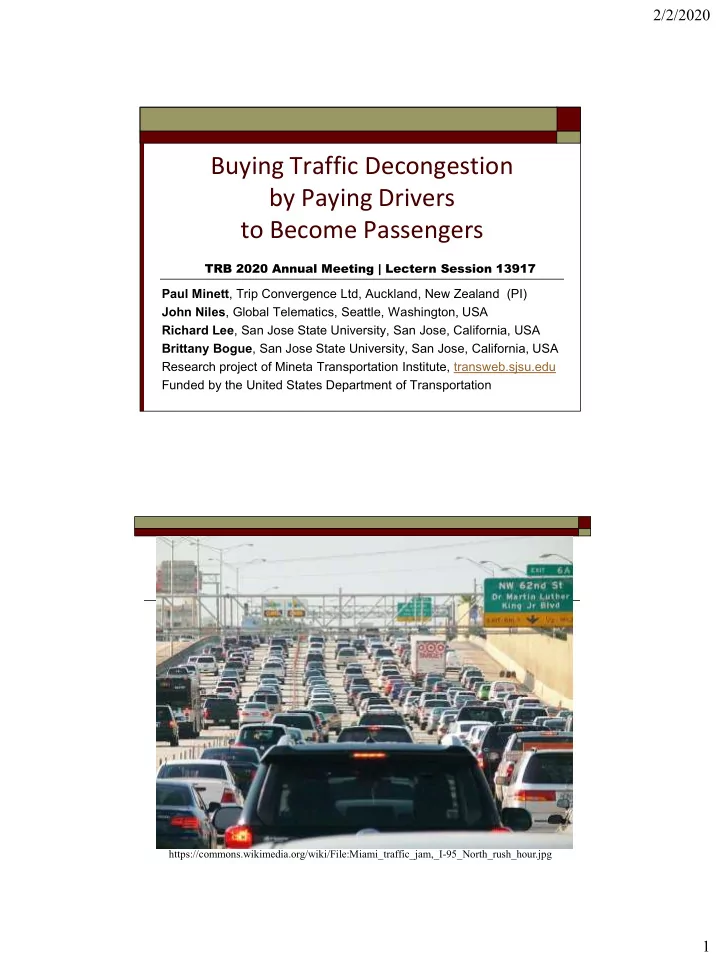
https://commons.wikimedia.org/wiki/File:Miami_traffic_jam,_I-95_North_rush_hour.jpg

slide-2
SLIDE 2

2/2/2020 2

U.S. Carpool Commuting Mode Share Low & Dropping

CARPOOL MODE SHARE SOV MODE SHARE 8% to 13% typical urban 70% to 80% typical urban

Proposed Solution for Reducing Congestion

Dynamically achieve a target level of reduced vehicle traffic by motivating enough SOV commuters to become passengers

  • Determine the amount of daily cash to

pay drivers to switch to being passengers

  • Pay enough, per person and in total, to

achieve the lower target

  • Establish as a permanent system
slide-3
SLIDE 3

2/2/2020 3

Project Sought Full Solution Design

STEPS in FULL SOLUTION DESIGN

  • Define corridor
  • Gather base data
  • Count traffic
  • Set desired traffic reduction
  • Determine incentive cost
  • Determine incentive structure
  • Calculate gross cost
  • Calculate year 1 total cost
  • Estimate later years cost
  • Forecast lifetime cost & B/C present value

Case study site in California

slide-4
SLIDE 4

2/2/2020 4

Case Study Site in The Bay Area

slide-5
SLIDE 5

2/2/2020 5

Case study site: Half Moon Bay, CA Case study: A Simple Bottleneck

slide-6
SLIDE 6

2/2/2020 6

Half Moon Bay Road to Silicon Valley

Case Study Bottleneck

slide-7
SLIDE 7

2/2/2020 7

Key Steps in the Full Design

 Surveyed Half Moon Bay citizens on attitudes,

travel behavior, and stated preferences for change

 Estimated price sensitivity in commuters

becoming passengers

 Did spreadsheet-based simulation of traffic

dynamics

 Calculated cost and benefit estimates for

permanent implementation

Main Data Source: Resident Survey

  • Geographic filtering of all-county voters list
  • 588 emails sent out that pointed to an
  • nline questionnaire
  • 120 responses made. Closely matched

census demographics

  • Sought travel behavior on “Typical

Tuesdays”

  • Personal strategies to avoid congestion?
  • Willing to travel as passenger?
  • What incentive payment needed?
slide-8
SLIDE 8

2/2/2020 8

Response to Congestion

12% Work from Home 18% Leave Early to Allow for Congestion 28% Leave Early to Avoid Congestion 37% Leave Later to Avoid Congestion None: 5%

Estimated Tuesday Morning Traffic Half Moon Bay, Summer 2019 Red shows traffic delayed at the bottleneck on State Route 92

Green is the extent of queue

slide-9
SLIDE 9

2/2/2020 9

Survey Response: Willingness to Share the Ride

Reward Sought for Being a Passenger

slide-10
SLIDE 10

2/2/2020 10

Simulated Tuesday Morning Traffic Half Moon Bay, Summer 2019 with Incentive-stimulated car pooling Red shows traffic still delayed Green shows remaining queue

Discovery: Reactive later departures would rebuild peak congestion

 3,700 commuters estimated to currently pass

through the bottleneck between 5 am and 9 am.

 But with congestion dissipated:

 2,600 (71%) would shift to a later departure

for a total of 1,735 hours more time at home

 620 (17%) would shift to an earlier departure

for a total of 490 hours of additional time at destination.

slide-11
SLIDE 11

2/2/2020 11

Current traffic in blue | Desired travel times IF no congestion in green

Intra-peak Demand Shift is Significant

The Good News

Analytical, empirical evidence in case study finds that a daily average $15 price per passenger motivates enough SOV commuters to become passengers that congestion is removed.

Removing congestion would allow people (88% in case study) to move departures to preferred times, so a going- early or going-late bonus is required to avoid re-peaking.

20-year present value benefit @ 3% discount rate is $640 million vs $140 million in costs; 4.5 benefit:cost.

Cost of this system may compete well with widening the highway or building/buying new transit infrastructure.

slide-12
SLIDE 12

2/2/2020 12

$640 Million, 20 Year Benefits, NPV

$140 Million, 20 Year Costs, NPV

slide-13
SLIDE 13

2/2/2020 13

Bottom Line

 Pending more peer review and your comment,

research team is eager to work further on congestion- clearing-payments methodology.

 Our documented, detailed, eight-step method is

ready for funding support of further testing in an innovative community. Your suggestions, please?!

 Envisioned as an iteratively-tuned, ITS-enabled

system of congestion relief – a game-changer!

 Thanks! PaulMinett@gmail.com or J@JohnNiles.com