
SLIDE 1
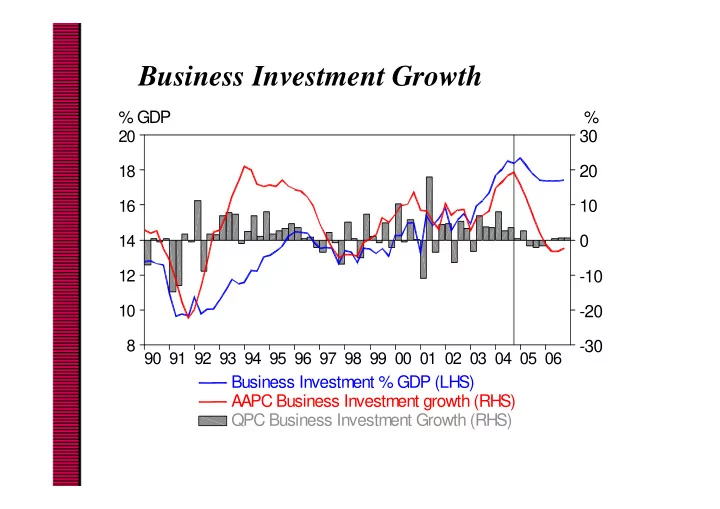
Business Investment Growth
06 05 04 03 02 01 00 99 98 97 96 95 94 93 92 91 90 20 18 16 14 12 10 8
30 20 10
- 10
- 20
- 30
% GDP % Business Investment % GDP (LHS) AAPC Business Investment growth (RHS) QPC Business Investment Growth (RHS)