Burlington Police Department Heroin Violations, 2012 - 2016 Number - - PowerPoint PPT Presentation

burlington police department heroin violations 2012 2016
SMART_READER_LITE
LIVE PREVIEW

Burlington Police Department Heroin Violations, 2012 - 2016 Number - - PowerPoint PPT Presentation

Burlington Police Department Heroin Violations, 2012 - 2016 Number er of Burlingt ngton on PD Heroin n Sales s & Poss ssess ession ion Violatio tions ns Possession Sale 20 18 16 tions (#) 14 olations 12 ed Viola 10 in


slide-1
SLIDE 1

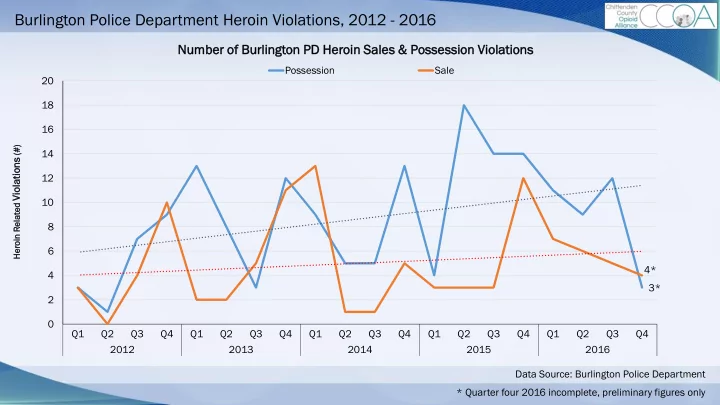
3* 4* 2 4 6 8 10 12 14 16 18 20 Q1 Q2 Q3 Q4 Q1 Q2 Q3 Q4 Q1 Q2 Q3 Q4 Q1 Q2 Q3 Q4 Q1 Q2 Q3 Q4 2012 2013 2014 2015 2016

Heroin in Related ed Viola

  • lations

tions (#)

Number er of Burlingt ngton

  • n PD Heroin

n Sales s & Poss ssess ession ion Violatio tions ns

Possession Sale

Burlington Police Department Heroin Violations, 2012 - 2016

Data Source: Burlington Police Department * Quarter four 2016 incomplete, preliminary figures only

slide-2
SLIDE 2

7* 8* 5* 5 10 15 20 25 30 Q1 Q2 Q3 Q4 Q1 Q2 Q3 Q4 Q1 Q2 Q3 Q4 Q1 Q2 Q3 Q4 Q1 Q2 Q3 Q4 2012 2013 2014 2015 2016 Drug Relat lated ed Arrests ests (#)

Number er of Burlingt ngton

  • n PD Drug

g Arrests sts by Drug Type

Marijuana Arrests Cocaine Arrests Heroin Arrests

Burlington Police Department Drug Arrests, 2012 - 2016

Data Source: Burlington Police Department * Quarter four 2016 incomplete, preliminary figures only

slide-3
SLIDE 3

Burlington Police Department Overdose Calls, 2012 - 2016

Data Source: Burlington Police Department 28 37 37* 69* 64* 10 20 30 40 50 60 70 80 2012 2013 2014 2015 2016 Calls lls for Servi vice e (#)

Number of Burlington PD Calls for Service Classified as “Overdose”*

* Figures shift due to reclassification, 2016 incomplete, preliminary figures only

slide-4
SLIDE 4

Chittenden Hub Treatment & Waitlist Volume, 2014 - 2016

725 923 939* 215 243 154* 100 200 300 400 500 600 700 800 900 1000 Q1 Q2 Q3 Q4 Q1 Q2 Q3 Q4 Q1 Q2 Q3 Q4 2014 2015 2016 Indiv ivid iduals als Waiti iting for Treatmen eatment Indiv ivid iduals als Rec eceiv eiving ing Treatmen eatment

Average age Quarterly erly Chittenden nden Hub (Howa ward d Center) ) Treatmen tment t & Waitlist ist Volumes mes

Data Source: Vermont Department of Health * Quarter four 2016 are most current figures, not average

slide-5
SLIDE 5

Chittenden Spokes Treatment Volume, Most Recent Census Period

Data Source: Opioid Care Alliance of Chittenden County Triage Team

Census sus Period d Start t Date Census sus Period End Date Spoke Clinic ic Number mber of Clien ents ts Treated

11/1/2015 10/31/2016 UVMMC COGS Clinic (pregnant or post-partum women only) 90 7/1/2016 9/30/2016 CHCB 195 7/1/2016 9/30/2016 Community PCPs 31 7/1/2016 9/30/2016 UVMMC PCPs 73 7/1/2016 9/30/2016 LUND 31 7/1/2016 9/30/2016 Maple Leaf 153

slide-6
SLIDE 6

Chittenden County Opioid-Related Accidental Fatal Overdoses, 2010 - 2015

13 13 17 17 17 17 18 18 19 19 20 20 5 16 16 6 12 18 24 2010 2011 2012 2013 2014 2015 Opioi

  • id

d Relat lated ed Fatali alities ties (#)

Number er of Ac Accident dental al Fatal Over erdos doses es Invol

  • lving

ng Opioids ids in Chitten enden den Count nty y by Opioi

  • id

d Type

All Opioids Rx Opioid (No Fentanyl) Heroin & Fentanyl Data Source: http://healthvermont.gov/research/documents/databrief_drug_related_fatalities.pdf

slide-7
SLIDE 7

Gaps in our Data – Non-Fatal Opioid Overdose Incidents

Ident ntifying ifying Data a Pa Partner ers Coordin inat ating ng Data a Collecti ection

  • n & Sharing

ng

  • VT Dep. Health willing to share EMS Siren data
  • UVM MC willing to share ED incidents and related data
  • Siren currently undergoing upgrade statewide with Januar

uary roll-out, in discussions about data collection post-upgrade.

  • In discussion with Jeffords Institute of UVM to provide data at regular intervals
slide-8
SLIDE 8

Gaps in our Data – Housing Insecurity due to Opioid Misuse

Ident ntifying ifying Data a Pa Partner ers Coordin inat ating ng Data a Collecti ection

  • n & Sharing

ng

  • BHA willing to work with CCOA to collect data
  • Champlain Housing identified as a potential data partner
  • BHA Data liaison identified and in contact with CommStat about data collection efforts
slide-9
SLIDE 9

Gaps in our Data – Cooccurrence of Homelessness & Opioid Misuse

Ident ntifying ifying Data a Pa Partner ers Coordin inat ating ng Data a Collecti ection

  • n & Sharing

ng

  • COTS willing to share data on self reported substance use
  • ANEW Place identified as a potential data partner
  • COTS provided preliminary data, from 2014 to 2016, and have indicated they

are willing to do further analysis alongside CommStat team

slide-10
SLIDE 10

Committee on Temporary Shelter Burlington Client Substance Abuse , 2014 - 2016

79% 79% 74% 74% 7% 7% 8% 8% 8% 8% 14% 18% 18% 0% 10% 20% 30% 40% 50% 60% 70% 80% 90% 100% 2014 2015 2016 Porti tion

  • n of Total

tal Year arly ly Clien ents ts Served ed (%)

Rate of Self-Repor eported ed Substan stance ce Ab Abuse se Among g COTS TS Burlingt ngton

  • n Clients,

ts, by Response

  • nse Type

Did not Report Self Reported No Substance Abuse Self Reported Substance Abuse Data Source: COTS of Burlington

slide-11
SLIDE 11

Data Source: COTS of Burlington

  • In 2014, 8.1% of National Population SUD in past

year.

  • “In January 2014, one in five people experiencing

homelessness had a serious mental illness, and a similar percentage had a chronic substance use disorder.”

http://www.samhsa.gov/data/sites/default/files/NSDUH-FRR1- 2014/NSDUH-FRR1-2014.pdf http://www.nationalhomeless.org/factsheets/addiction.pdf

Supporti

  • rtive

ve Case e Managem agemen ent 37% 37% Housin ing g Searc arch 15% 15% Emergen rgency Shelt lter er 15% 15% Drop

  • p-In

In Center nter 14% 14% Emergen rgency Shelt lter er Families ilies 10% 10% Case e Manage agemen ent 9% 9%

Rate of Self-Reported Substance Abuse by Service Provided, 2016

Committee on Temporary Shelter Burlington Client Substance Abuse , 2016

slide-12
SLIDE 12

Gaps in our Data – Children in Foster Care due to Parental Opioid Misuse

Ident ntifying ifying Data a Pa Partner ers Coordin inat ating ng Data a Collecti ection

  • n & Sharing

ng

  • DCF willing to share data on incidents involving substance use
  • DCF provided preliminary data from 2015 and have indicated they are willing

to do further analysis alongside CommStat team

slide-13
SLIDE 13

Department for Children & Families, VT Children under 6 in Care, 2015

In Care Due to Guardian Opioid Use Issues 51%, , (N = 276) In Care Due to Other Guardian Substance Use Issues 13%, , (N = 60) In Care NOT Due to Guardian Substance Use Issues 36% 36%, , (N = 194)

VT Childr dren en Un Under er 6 in Care by Type, 2015

Child d Age i in Years Nu Number r of Childr dren in Care 11 1 8 2 5 3 7 4 7 5 6 Grand d Tot

  • tal

44 44

15.94 94% % of the total youth under six who came into custody due to a guardian’s opioid abuse did so in Chittenden County (44 of 276 cases) Age Distributi tribution

  • n of Childr

dren n Un Under 6

in Care Due to Guardian Opioid Issues, Chittenden County

The majority of cases with children under 6 involve gua uardian ian opioid

  • id abuse

use or related issues.

Data Source: Vermont Department for Children and Families