Budgets in the Sea of Galilee Alon Rimmer 1 , Rana Samuels 2 , Amir - - PowerPoint PPT Presentation

budgets in the sea of galilee
SMART_READER_LITE
LIVE PREVIEW

Budgets in the Sea of Galilee Alon Rimmer 1 , Rana Samuels 2 , Amir - - PowerPoint PPT Presentation

Using high resolution Climate Model to Evaluate Future Water and Solutes Budgets in the Sea of Galilee Alon Rimmer 1 , Rana Samuels 2 , Amir Givati 3 , Pinhas Alpert 2 ( 1 ) Israel Oceanographic & Limnological Research Ltd. (IOLR). The


slide-1
SLIDE 1

Using high resolution Climate Model to Evaluate Future Water and Solutes Budgets in the Sea of Galilee

Alon Rimmer1, Rana Samuels2, Amir Givati3,

Pinhas Alpert2 (1) Israel Oceanographic & Limnological Research Ltd. (IOLR). The Kinneret Limnological Laboratory (KLL) (2) Department of Geophysics and Planetary Sciences, Faculty of Exact Sciences, Tel Aviv University, Israel (3) Israeli Hydrological Service, Water Authority, Israel

slide-2
SLIDE 2

Objectives

  • Combine climate and hydrological models to

predict long term patterns of water availability and water quality in the Lake Kinneret (Israel) watershed;

  • Explain how these models may contribute to

improve the water management of hydrological systems that are affected by climate change.

  • Provide a first prediction estimate for expected

changes in the region.

slide-3
SLIDE 3
  • 215
  • 220
  • 225
  • 230
  • 235
  • 245
  • 240
  • 250

Bet Tzeida Fuliya Dugit H a

  • n
  • E

i n G e v T i b e r i a s Barbutim Tabgha Gofra 32o54’ 32o48’ 32o52’ 32o50’ 32o46’ 32o44’ 35o35’ 35o31’ 35o39’ Jordan River N

3 km 6

a b c

                                                                                                                                                                                                   

Syria Syria Syria Syria Syria Syria Syria Syria Syria L e b a n

  • n

L e b a n

  • n

L e b a n

  • n

L e b a n

  • n

L e b a n

  • n

L e b a n

  • n

L e b a n

  • n

L e b a n

  • n

L e b a n

  • n
  • Mt. Hermon
  • Mt. Hermon
  • Mt. Hermon
  • Mt. Hermon
  • Mt. Hermon
  • Mt. Hermon
  • Mt. Hermon
  • Mt. Hermon
  • Mt. Hermon

15 km

J

  • r

d a n J

  • r

d a n J

  • r

d a n J

  • r

d a n J

  • r

d a n J

  • r

d a n J

  • r

d a n J

  • r

d a n J

  • r

d a n K i n g d

  • m

K i n g d

  • m

K i n g d

  • m

K i n g d

  • m

K i n g d

  • m

K i n g d

  • m

K i n g d

  • m

K i n g d

  • m

K i n g d

  • m

J

  • r

d a n R i v e r J

  • r

d a n R i v e r J

  • r

d a n R i v e r J

  • r

d a n R i v e r J

  • r

d a n R i v e r J

  • r

d a n R i v e r J

  • r

d a n R i v e r J

  • r

d a n R i v e r J

  • r

d a n R i v e r

Israel Israel Israel Israel Israel Israel Israel Israel Israel

Upper Jordan River Upper Jordan River Upper Jordan River Upper Jordan River Upper Jordan River Upper Jordan River Upper Jordan River Upper Jordan River Upper Jordan River catchments catchments catchments catchments catchments catchments catchments catchments catchments Direct Direct Direct Direct Direct Direct Direct Direct Direct watershed watershed watershed watershed watershed watershed watershed watershed watershed west west west west west west west west west Direct Direct Direct Direct Direct Direct Direct Direct Direct watershed watershed watershed watershed watershed watershed watershed watershed watershed east east east east east east east east east

Lake Lake Lake Lake Lake Lake Lake Lake Lake Kinneret Kinneret Kinneret Kinneret Kinneret Kinneret Kinneret Kinneret Kinneret KFAR KFAR KFAR KFAR KFAR KFAR KFAR KFAR KFAR KFAR KFAR KFAR KFAR KFAR KFAR KFAR KFAR KFAR KFAR KFAR KFAR KFAR KFAR KFAR KFAR KFAR KFAR KFAR KFAR KFAR KFAR KFAR KFAR KFAR KFAR KFAR KFAR KFAR KFAR KFAR KFAR KFAR KFAR KFAR KFAR KFAR KFAR KFAR KFAR GILADI GILADI GILADI GILADI GILADI GILADI GILADI GILADI GILADI GILADI GILADI GILADI GILADI GILADI GILADI GILADI GILADI GILADI GILADI GILADI GILADI GILADI GILADI GILADI GILADI GILADI GILADI GILADI GILADI GILADI GILADI GILADI GILADI GILADI GILADI GILADI GILADI GILADI GILADI GILADI GILADI GILADI GILADI GILADI GILADI GILADI GILADI GILADI GILADI DAFNA DAFNA DAFNA DAFNA DAFNA DAFNA DAFNA DAFNA DAFNA DAFNA DAFNA DAFNA DAFNA DAFNA DAFNA DAFNA DAFNA DAFNA DAFNA DAFNA DAFNA DAFNA DAFNA DAFNA DAFNA DAFNA DAFNA DAFNA DAFNA DAFNA DAFNA DAFNA DAFNA DAFNA DAFNA DAFNA DAFNA DAFNA DAFNA DAFNA DAFNA DAFNA DAFNA DAFNA DAFNA DAFNA DAFNA DAFNA DAFNA GOLAN EXP. GOLAN EXP. GOLAN EXP. GOLAN EXP. GOLAN EXP. GOLAN EXP. GOLAN EXP. GOLAN EXP. GOLAN EXP. GOLAN EXP. GOLAN EXP. GOLAN EXP. GOLAN EXP. GOLAN EXP. GOLAN EXP. GOLAN EXP. GOLAN EXP. GOLAN EXP. GOLAN EXP. GOLAN EXP. GOLAN EXP. GOLAN EXP. GOLAN EXP. GOLAN EXP. GOLAN EXP. GOLAN EXP. GOLAN EXP. GOLAN EXP. GOLAN EXP. GOLAN EXP. GOLAN EXP. GOLAN EXP. GOLAN EXP. GOLAN EXP. GOLAN EXP. GOLAN EXP. GOLAN EXP. GOLAN EXP. GOLAN EXP. GOLAN EXP. GOLAN EXP. GOLAN EXP. GOLAN EXP. GOLAN EXP. GOLAN EXP. GOLAN EXP. GOLAN EXP. GOLAN EXP. GOLAN EXP. STATION STATION STATION STATION STATION STATION STATION STATION STATION STATION STATION STATION STATION STATION STATION STATION STATION STATION STATION STATION STATION STATION STATION STATION STATION STATION STATION STATION STATION STATION STATION STATION STATION STATION STATION STATION STATION STATION STATION STATION STATION STATION STATION STATION STATION STATION STATION STATION STATION MERON MERON MERON MERON MERON MERON MERON MERON MERON MERON MERON MERON MERON MERON MERON MERON MERON MERON MERON MERON MERON MERON MERON MERON MERON MERON MERON MERON MERON MERON MERON MERON MERON MERON MERON MERON MERON MERON MERON MERON MERON MERON MERON MERON MERON MERON MERON MERON MERON

  • 215
  • 220
  • 225
  • 230
  • 235
  • 245
  • 240
  • 250

Bet Tzeida Fuliya Dugit H a

  • n
  • E

i n G e v T i b e r i a s Barbutim Tabgha Gofra 32o54’ 32o48’ 32o52’ 32o50’ 32o46’ 32o44’ 35o35’ 35o31’ 35o39’ Jordan River N

3 km 6

  • 215
  • 220
  • 225
  • 230
  • 235
  • 245
  • 240
  • 250

Bet Tzeida Fuliya Dugit H a

  • n
  • E

i n G e v T i b e r i a s Barbutim Tabgha Gofra 32o54’ 32o48’ 32o52’ 32o50’ 32o46’ 32o44’ 35o35’ 35o31’ 35o39’ Jordan River N

3 km 6

a b c

                                                                                                                                                                                                   

Syria Syria Syria Syria Syria Syria Syria Syria Syria L e b a n

  • n

L e b a n

  • n

L e b a n

  • n

L e b a n

  • n

L e b a n

  • n

L e b a n

  • n

L e b a n

  • n

L e b a n

  • n

L e b a n

  • n
  • Mt. Hermon
  • Mt. Hermon
  • Mt. Hermon
  • Mt. Hermon
  • Mt. Hermon
  • Mt. Hermon
  • Mt. Hermon
  • Mt. Hermon
  • Mt. Hermon

15 km

J

  • r

d a n J

  • r

d a n J

  • r

d a n J

  • r

d a n J

  • r

d a n J

  • r

d a n J

  • r

d a n J

  • r

d a n J

  • r

d a n K i n g d

  • m

K i n g d

  • m

K i n g d

  • m

K i n g d

  • m

K i n g d

  • m

K i n g d

  • m

K i n g d

  • m

K i n g d

  • m

K i n g d

  • m

J

  • r

d a n R i v e r J

  • r

d a n R i v e r J

  • r

d a n R i v e r J

  • r

d a n R i v e r J

  • r

d a n R i v e r J

  • r

d a n R i v e r J

  • r

d a n R i v e r J

  • r

d a n R i v e r J

  • r

d a n R i v e r

Israel Israel Israel Israel Israel Israel Israel Israel Israel

Upper Jordan River Upper Jordan River Upper Jordan River Upper Jordan River Upper Jordan River Upper Jordan River Upper Jordan River Upper Jordan River Upper Jordan River catchments catchments catchments catchments catchments catchments catchments catchments catchments Direct Direct Direct Direct Direct Direct Direct Direct Direct watershed watershed watershed watershed watershed watershed watershed watershed watershed west west west west west west west west west Direct Direct Direct Direct Direct Direct Direct Direct Direct watershed watershed watershed watershed watershed watershed watershed watershed watershed east east east east east east east east east

Lake Lake Lake Lake Lake Lake Lake Lake Lake Kinneret Kinneret Kinneret Kinneret Kinneret Kinneret Kinneret Kinneret Kinneret KFAR KFAR KFAR KFAR KFAR KFAR KFAR KFAR KFAR KFAR KFAR KFAR KFAR KFAR KFAR KFAR KFAR KFAR KFAR KFAR KFAR KFAR KFAR KFAR KFAR KFAR KFAR KFAR KFAR KFAR KFAR KFAR KFAR KFAR KFAR KFAR KFAR KFAR KFAR KFAR KFAR KFAR KFAR KFAR KFAR KFAR KFAR KFAR KFAR GILADI GILADI GILADI GILADI GILADI GILADI GILADI GILADI GILADI GILADI GILADI GILADI GILADI GILADI GILADI GILADI GILADI GILADI GILADI GILADI GILADI GILADI GILADI GILADI GILADI GILADI GILADI GILADI GILADI GILADI GILADI GILADI GILADI GILADI GILADI GILADI GILADI GILADI GILADI GILADI GILADI GILADI GILADI GILADI GILADI GILADI GILADI GILADI GILADI DAFNA DAFNA DAFNA DAFNA DAFNA DAFNA DAFNA DAFNA DAFNA DAFNA DAFNA DAFNA DAFNA DAFNA DAFNA DAFNA DAFNA DAFNA DAFNA DAFNA DAFNA DAFNA DAFNA DAFNA DAFNA DAFNA DAFNA DAFNA DAFNA DAFNA DAFNA DAFNA DAFNA DAFNA DAFNA DAFNA DAFNA DAFNA DAFNA DAFNA DAFNA DAFNA DAFNA DAFNA DAFNA DAFNA DAFNA DAFNA DAFNA GOLAN EXP. GOLAN EXP. GOLAN EXP. GOLAN EXP. GOLAN EXP. GOLAN EXP. GOLAN EXP. GOLAN EXP. GOLAN EXP. GOLAN EXP. GOLAN EXP. GOLAN EXP. GOLAN EXP. GOLAN EXP. GOLAN EXP. GOLAN EXP. GOLAN EXP. GOLAN EXP. GOLAN EXP. GOLAN EXP. GOLAN EXP. GOLAN EXP. GOLAN EXP. GOLAN EXP. GOLAN EXP. GOLAN EXP. GOLAN EXP. GOLAN EXP. GOLAN EXP. GOLAN EXP. GOLAN EXP. GOLAN EXP. GOLAN EXP. GOLAN EXP. GOLAN EXP. GOLAN EXP. GOLAN EXP. GOLAN EXP. GOLAN EXP. GOLAN EXP. GOLAN EXP. GOLAN EXP. GOLAN EXP. GOLAN EXP. GOLAN EXP. GOLAN EXP. GOLAN EXP. GOLAN EXP. GOLAN EXP. STATION STATION STATION STATION STATION STATION STATION STATION STATION STATION STATION STATION STATION STATION STATION STATION STATION STATION STATION STATION STATION STATION STATION STATION STATION STATION STATION STATION STATION STATION STATION STATION STATION STATION STATION STATION STATION STATION STATION STATION STATION STATION STATION STATION STATION STATION STATION STATION STATION MERON MERON MERON MERON MERON MERON MERON MERON MERON MERON MERON MERON MERON MERON MERON MERON MERON MERON MERON MERON MERON MERON MERON MERON MERON MERON MERON MERON MERON MERON MERON MERON MERON MERON MERON MERON MERON MERON MERON MERON MERON MERON MERON MERON MERON MERON MERON MERON MERON

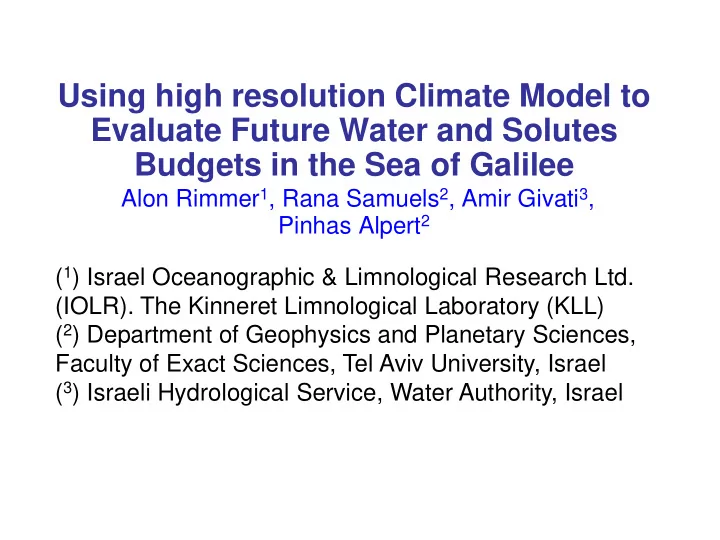
East Mediterranean. Lake Kinneret and the regions with saline springs (Dark). The Lake Kinneret watershed

Orientation maps

slide-4
SLIDE 4

Introduction

Results from a high resolution global climate model were integrated into hydrological tools to provide a first approximation of climate change impacts on water quantity and quality in the Sea of Galilee (Lake Kinneret), the major freshwater resource in Israel.

  • Precipitation data extracted from a climate model were

downscaled and used in a hydrological stream flow model

  • The precipitation data were used in a multiple regression

model to calculate annual incoming water volumes.

  • Simultaneously, meteorological data were used in a model

based on modified Penman equation, to calculate annual lake evaporation.

  • The salinity in the lake was calculated with the results of

the previous models, using a system approach lake salinity model, assuming a complete mixing mechanism.

slide-5
SLIDE 5
  • 1. high-resolution

Global Climate Model

  • 2. Evaporation

Model

  • 4. Lake salinity

Model

Temperature, relative humidity, radiation, wind speed Precipitation Lake heat storage change Evaporation

  • 3. Water

inflows Model

Water inflows Lake volume Solute inflow Water outflows Lake salinity

model Input-Output Input LEGEND

Schematic description of the proposed cascade of models

slide-6
SLIDE 6

Characteristic

  • 1. Climate model
  • 2. LK Evaporation
  • 3. Water inflows
  • 4. LK salinity

[Time interval] [day] [day] [year] [year]

Input

Climate-model version of the Japan Meteorological Agency’s (JMA) operational numerical weather prediction model. Daily values for temperature (T), relative humidity (RH), global radiation (Rs) and wind speed (U) as extracted from the climate model Annual precipitation (P) in mm from current and previous year, extracted from the climate model. Annual long term predictions for inflows (IW) and outflows in Mm3; Annual evaporation values from the lake (∑ED) in Mm3; Annual solute inflows (Sin) to the lake in ton Cl-.

Output

Climate simulations for past (1979-2007) and future (2015-2034). Daily values for precipitation (P), temperature (T), relative humidity (RH), global radiation (Rs) and wind speed (U) Daily evaporation values from the lake (ED) in Mm3 Annual long term predictions for incoming water to the lake (IW) in Mm3 Long-term predictions of volume (V) in Mm3, solute mass (S) in ton, and salinity C in ppm Cl-.

Objective

To understand evolution of relevant atmospheric variables in the face of climate change To generate evaporation calculations for use in the water balance and salinity model. To predict annual water inflows to the lake. To use the physical mechanism

  • f CM as a tool to predict long-

term changes of chloride concentration in LK.

System verification

Precipitation: apply bias correction and compare with historical values of rain gauges in UCJR. Evaporation: compare relevant atmospheric parameters with historic values Compare monthly averaged modeled values with historical values Compare predicted vs.

  • bserved values of water

inflows Compare predicted vs. observed values of lake volume and salinity from 1964 to 2005

Calibration

For precipitation values, bias correction (Deque, 2006). For evaporation parameters, no calibration required No calibration required Based on regression coefficients No calibration required

References

Mizuta et al (2006), Kitoh et al (2008) Rimmer et al. (2009). Givati and Rosenfeld (2007) Rimmer (2003). Rimmer et al (2006).

slide-7
SLIDE 7

Climate model

Model name - A climate model version of the Japan Meteorological Agency’s (JMA) operational numerical weather prediction model Horizontal grid size - 20 km Advantages – 1. The model resolution allows for a more realistic representation of topography. 2. Currently, this is the only GCM available at this resolution. 3. It has been shown to be skillful at showing precipitation changes over the "fertile crescent" and recently has been shown to outperform reanalysis data in the region of the Middle East. Literature - Mizuta et al. 2006; Kitoh et al. 2008; Jin et al. 2009.

high-resolution Global Climate Model

slide-8
SLIDE 8

Downscaling the combined climate and hydrological models

“Bridging the scale gap” between climate change models (spatial scale of 50-100s of kilometers) and hydrological and

  • ther response

models (watershed specific, input spatial scale at local or gauge level) to understand climate change impacts on water sources at the local level.

Global Climate Models Regional Climate Models Hydrology, Vegetation, Topography Courtesy Dr. David Vine, UEA

high-resolution Global Climate Model

slide-9
SLIDE 9

Downscaling method

  • daily values from both the observed data and modeled

data for the historical period are ordered sequentially.

  • These two time-series are then divided into

percentiles and the mean for each percentile is calculated.

  • The bias correction factor (bcf) for each percentile i is

calculated by subtracting the mean of the modeled data (y) from the mean of the observed data (x) such that.

  • This correction factor is then applied to all the daily

values in the modeled time series based on the appropriate percentile.

 

i i i

y x bcf  

high-resolution Global Climate Model

slide-10
SLIDE 10

Downscaling results

Figure 2: Inverse CDF (top row) and Q-Q plots (bottom row) for precipitation based on observed values at four rainfall stations and results from the 20km GCM model for the years 1979-2007 (28 years)

60 70 80 90 100 100 20 40 60 Kefar Giladi quantile 60 70 80 90 100 20 40 60

Dafna

quantile 60 70 80 90 100 20 40 60

Meron

quantile 60 70 80 90 100 20 40 60

Golan Exp

mm quantile 20 40 60 20 40 60 mm 20 40 60 20 40 60 mm 20 40 60 20 40 60 mm 20 40 60 20 40 60 mm mm

high-resolution Global Climate Model

slide-11
SLIDE 11

Climate model verification

Meteorological parameters used for evaporation calculations (a-e),

  • bserved (blue) vs. modeled (red) data for the historical period 1996-
  • 2007. Calculated evaporation based on Penman is also shown (f).

10 15 20 25 30 35 40 degrees

  • a. T min

10 15 20 25 30 35 40 degrees

  • b. T max

30 40 50 60 70 80 %

  • c. Relative Humidity

2 4 6 8 10 12 1.5 2.0 2.5 3.0 3.5 4.0 M s-1

  • d. Wind speed

2 4 6 8 10 12 5 10 15 20 25 30 W m-2

  • e. Radiation

2 4 6 8 10 12 5 10 15 20 25 30 Mm3

  • f. Evaporation

month

high-resolution Global Climate Model

slide-12
SLIDE 12

Annual inflows - multiple regression model

      

   

  • IW(i) is the predicted annual incoming water in the lake (Mm3),
  • PGH(i) is the annual precipitation (mm) on the Golan height,
  • PGH(i-1) is the annual precipitation (mm) in the Golan height in

previous year.

  • The parameters a=1.04, b=0.18, and c=-355 are constants

determined by a calibration process.

     

c P b P a IW

1 i GH i GH i

    

Water inflows Model

slide-13
SLIDE 13

Verification of annual inflows - multiple regression model

200 400 600 800 1000 1200 1400 1600 Hydrological year Precipitation [mm] 200 400 600 800 1000 1200 1400 Inflows [Mm^3]

Annual rainfall Incoming water

y = 0.9707x + 20.507 R

2

= 0.9707

500 1000 1500 500 1000 1500

Measured annual inflows [Mm^3] Calculated annual inflows [Mm^3]

Water inflows Model

slide-14
SLIDE 14

Penman-Monteith (Allen et al. 1998; Valiantzas 2006)

1 2 3

    

L e e u f L * G R E

a aS L n

            

1: Evaporation (mm/day) 2: The “Radiation component” - Net radiation Rn, DGL is all measured heat storage change per area in the lake including inflows and outflows. 3: The “Wind component” where f(u) is the wind function, eaS and ea are the saturated and dry vapor pressure of the air respectively. D -The slope of the saturation vapor pressure temperature curve. -Psychrometric constant. L- Latent heat of vaporization.

Evaporation Model

slide-15
SLIDE 15

Verification of evaporation model

5 10 15 20 25 30 35 Jan Feb Mar Apr May Jun Jul Aug Sep Oct Nov Dec Month Evaporation [Mm^3]

model 2003 balance 2003

5 10 15 20 25 30 35 Jan Feb Mar Apr May Jun Jul Aug Sep Oct Nov Dec Month Evaporation [Mm^3]

model 2004 balance 2004

5 10 15 20 25 30 35 Jan Feb Mar Apr May Jun Jul Aug Sep Oct Nov Dec Month Evaporation [Mm^3]

model 2005 balance 2005

5 10 15 20 25 30 35 Jan Feb Mar Apr May Jun Jul Aug Sep Oct Nov Dec Month Evaporation [Mm^3]

model 2006 balance 2006

Evaporation Model

slide-16
SLIDE 16

Complete mixing equations

     

t S t S dt t dS

in

  • ut

 

                       

t S t q t S t V t Q t S t V t S t C t C t Q t S

  • ut
  • ut

lake lake

  • ut
  • ut

   

Solute mass conservation

             

t C t Q t S t Q t C t Q t C

in in in i i i i i in

 

 

The definition of Sout and q The definition of Sin

lake

  • utC

Q

in inC

Q

V·Clake=S Q1C1 Q2C2 Q3C3 Q4C4

Lake salinity Model

slide-17
SLIDE 17

Complete mixing – general solution

       

                             

  

in t t ' ' t

S ' dt ' t S dt ' ' t q exp ' dt ' t q exp t S

'

       

t S t S t q dt t dS

in

 

Initial conditions

t

S S 

Solute mass conservation equation General solution of the solute mass conservation equation

Lake salinity Model

slide-18
SLIDE 18

Verification of salinity model: result for 1964-87

1960 1965 1970 1975 1980 1985 1990 0.9 1.0 1.1 1.2 1.3 1.4 1.5 1.6 1965 1970 1975 1980 1985 1990 220 240 260 280 300 320 340 360 380

salinity (ppm Cl-) Solute mass (109 kg) year

S0=1,550  106 kg q=0.127 Sin=95106 kg

Model Measured

The reduction in solute mass and salinity between 1964 and 1987 is an obvious result of the operation of the SWC in 1964

Lake salinity Model

slide-19
SLIDE 19

0.75 0.95 1.15 1.35 1.55 1.75 1962 1972 1982 1992 2002 Year Cl- storage (106 ton) Model Measured S0=1,655,000 ton q= -0.0011 × year + 2.319 Sin=107 , 000 ton q (1/year) 0.04 0.12 0.20 0.28 0.36 Calculated Regression line

a b

Lake salinity Model

Verification of salinity model: result for 1964-2005

Combined effect of the operation of the SWC in 1964 and the reduction in fresh water inflows from the Jordan River and the local streams.

slide-20
SLIDE 20

Temperature, relative humidity, radiation, wind speed Precipitation Lake Evaporation Lake volume Water outflows Lake salinity

       

                          

  

in t t ' ' t

S ' dt ' t S dt ' ' t q exp ' dt ' t q exp t S

'

Lake salinity model- Complete mixing

Water inflows Solute inflow

Climate-model version of the Japan Meteorological Agency’s (JMA) operational numerical weather prediction model

model Input-Output Input LEGEND

     

c P b P a IW

1 i GH i GH i

    

Annual inflows- multiple regression model

IW : Annual incoming water PGH(i) : Annual precipitation PGH(i-1): Precipitation in previous year. a, b, c: Constants determined by a calibration process.

y = 18.756 + 0.9719x R2= 0.986 Calculated IW [106 m3 year-1] Observed IW [106 m3 year-1]

IW calibration

    

L e e u f L G R E

a aS n

            

Lake Evaporation model- Penman approach

Actual Calc Monthly evaporation Lake Kinnert [Mcm] month

E calibration E: Evaporation [mm/day] Rn : Net radiation; G : Lake heat storage change f(u): The wind function, eaS , ea Saturated and dry vapor pressure : Slope of saturation vapor pressure temp curve -Psychrometric constant. ; L- Latent heat of vaporization.

Lake heat storage change

S(t): Solute mass in the lake as function of time S0: Initial Solute mass in the lake Sin: Solute inflows to the lake q: Ratio of water outflows/lake volume t: time

Year Cl- storage [106 ton] Model Measured

Salinity verification

slide-21
SLIDE 21

Results of GCM predictions

Year 200 220 240 260 280 300

1970 1980 1990 2000 2010 2020 2030 2040

Modeled evaporation Observed evaporation Annual Evaporation [mcm] B 500 1000 1500 2000

1970 1980 1990 2000 2010 2020 2030 2040

Observed precipitation Modeled precipitation Annual precipitation [mm / y] Year A

Calculated precipitation (A) and evaporation (B) from the models for both the historical time period (1979-2007) and the future (2015-2034) as well as observed values.

precipitation Evaporation

slide-22
SLIDE 22

Results of GCM predictions

Typical model results: a. Historical Lake Kinnert level for the period 1968-2008; Modeled lake level: In 2009-2015 outflow = available water, and in 2015-2035 we allowed outflow = available water + 10 Mm3 annually. b. Actual salinity in lake Kinneret (1968-2009) and expected salinity using inflow from the hydrological model and outflows were 10 Mm3 above the annual available water b

180 200 220 240 260 280 300 320 340 360 1968 1977 1988 1997 2008 2017 2028 date Lake Kinneret salinity (ppm Cl) Predicted salinity- monthly Salinity ± Errors Measured salinity

Upper “red line”

  • 220
  • 218
  • 216
  • 214
  • 212
  • 210
  • 208

Level (m) Predicted Level (m ASL) Lake Level

a

Lower “red line”

Lake level Salinity

slide-23
SLIDE 23

Summary

  • The results of a global climate model were integrated into a

water availability, evaporation and salinity model in order to determine the impact of climate change on water quality and quantity in Lake Kinneret.

  • The analysis we demonstrated is based on a single scenario

from a single climate model.

  • Given that it is only a single potential representation of future

climate, these results should be viewed as a first estimation which must be compared to results of other climate models and additional scenarios.

  • In future research we plan to build ensembles from multiple

climate models in order to get a more robust and reliable estimation of expected changes in rainfall and evaporation which in turn can be used to better inform planners regarding lake water change and salinity.

  • While this study focuses on a particular region, the

methodologies presented are general and can be applied to other water bodies as well.

slide-24
SLIDE 24

180 200 220 240 260 280 300 320 340 360 1968 1977 1988 1997 2008 2017 2028

date Lake Kinneret salinity (ppm Cl)

Predicted salinity- monthly Predicted salinity Salinity+Errors Salinity-Errors Measured salinity 180 200 220 240 260 280 300 320 340 1968 1977 1988 1997 2008 2017 2028

date Lake Kinneret salinity (ppm Cl)

Predicted salinity- monthly Predicted salinity Salinity+Errors Salinity-Errors Measured salinity 180 200 220 240 260 280 300 320 340 360 1968 1977 1988 1997 2008 2017 2028

date Lake Kinneret salinity (ppm Cl)

Predicted salinity- monthly Predicted salinity Salinity+Errors Salinity-Errors Measured salinity 180 200 220 240 260 280 300 320 340 360 380 400 1968 1977 1988 1997 2008 2017 2028

date Lake Kinneret salinity (ppm Cl)

Predicted salinity- monthly Predicted salinity Salinity+Errors Salinity-Errors Measured salinity

a1 a2 b1 b2