Brewing Analytics Quality for Cloud Performance Li Chen Kingsum - - PDF document

brewing analytics quality for cloud performance
SMART_READER_LITE
LIVE PREVIEW

Brewing Analytics Quality for Cloud Performance Li Chen Kingsum - - PDF document

10/21/2015 Brewing Analytics Quality for Cloud Performance Li Chen Kingsum Chow, Pooja Jain Emad Guirguis, Tony Wu 2015-07-24T13:53:13.141-0700: 75.604: [GC [PSYoungGen: 1133359K->165347K(1223680K)] 1133447K->165470K(4020224K),


slide-1
SLIDE 1

10/21/2015 1

Brewing Analytics Quality for Cloud Performance

Li Chen Kingsum Chow, Pooja Jain Emad Guirguis, Tony Wu

System Technologies and Optimization

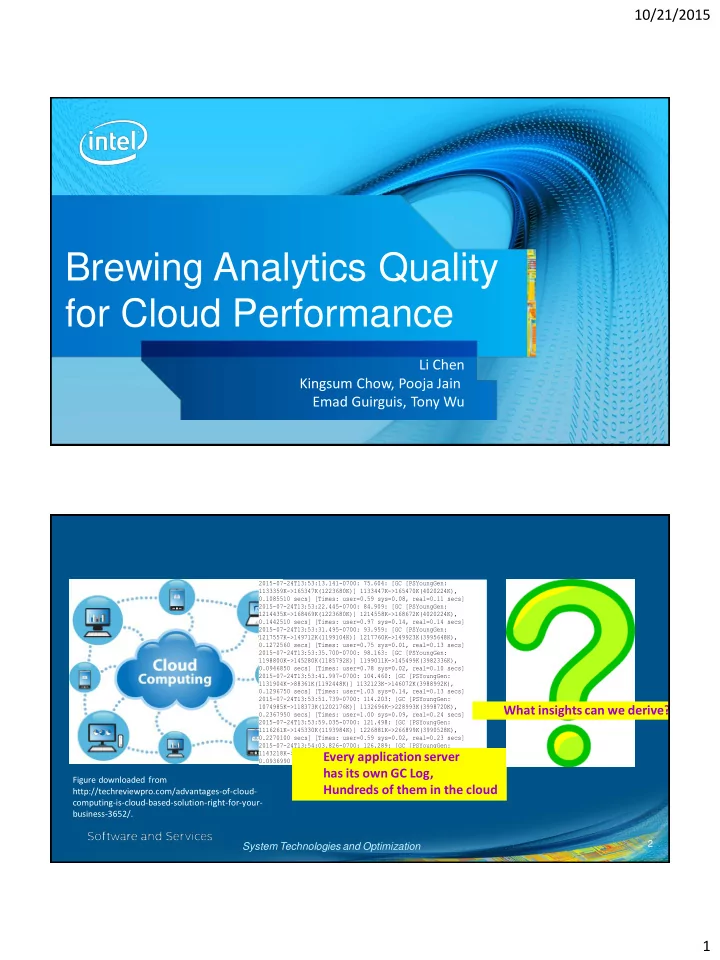
2 Figure downloaded from http://techreviewpro.com/advantages-of-cloud- computing-is-cloud-based-solution-right-for-your- business-3652/.

2015-07-24T13:53:13.141-0700: 75.604: [GC [PSYoungGen: 1133359K->165347K(1223680K)] 1133447K->165470K(4020224K), 0.1085510 secs] [Times: user=0.59 sys=0.08, real=0.11 secs] 2015-07-24T13:53:22.445-0700: 84.909: [GC [PSYoungGen: 1214435K->168469K(1223680K)] 1214558K->168672K(4020224K), 0.1442510 secs] [Times: user=0.97 sys=0.14, real=0.14 secs] 2015-07-24T13:53:31.495-0700: 93.959: [GC [PSYoungGen: 1217557K->149712K(1199104K)] 1217760K->149923K(3995648K), 0.1272560 secs] [Times: user=0.75 sys=0.01, real=0.13 secs] 2015-07-24T13:53:35.700-0700: 98.163: [GC [PSYoungGen: 1198800K->145280K(1185792K)] 1199011K->145499K(3982336K), 0.0946850 secs] [Times: user=0.78 sys=0.02, real=0.10 secs] 2015-07-24T13:53:41.997-0700: 104.460: [GC [PSYoungGen: 1131904K->88361K(1192448K)] 1132123K->146072K(3988992K), 0.1296750 secs] [Times: user=1.03 sys=0.14, real=0.13 secs] 2015-07-24T13:53:51.739-0700: 114.203: [GC [PSYoungGen: 1074985K->118373K(1202176K)] 1132696K->228993K(3998720K), 0.2367950 secs] [Times: user=1.00 sys=0.09, real=0.24 secs] 2015-07-24T13:53:59.035-0700: 121.498: [GC [PSYoungGen: 1116261K->145330K(1193984K)] 1226881K->266899K(3990528K), 0.2270100 secs] [Times: user=0.59 sys=0.02, real=0.23 secs] 2015-07-24T13:54:03.826-0700: 126.289: [GC [PSYoungGen: 1143218K->53006K(1190912K)] 1264787K->233618K(3987456K), 0.0936990 secs] [Times: user=0.56 sys=0.09, real=0.10 secs]

Every application server has its own GC Log, Hundreds of them in the cloud What insights can we derive?

slide-2
SLIDE 2

10/21/2015 2

System Technologies and Optimization

Outline

  • Introduction
  • Motivation and challenges
  • Assessing analytics quality for cloud
  • Case study on a cloud workload
  • Summary and Discussion

3

System Technologies and Optimization

Cloud Performance Analytics Flow

4

Exp Design

Performance Data Collection

Characterize

Data Cleansing Preparation

Analyze

Model Construction Analytics

Model

Capacity Planning

slide-3
SLIDE 3

10/21/2015 3

System Technologies and Optimization

Performance Data

  • Platform monitoring:
  • Java logs
  • Garbage collection (GC) logs
  • System monitoring:
  • System Report Activity (SAR)
  • CPU monitoring:
  • perf
  • User experience monitoring:
  • Faban driver

5

System Technologies and Optimization

What Performance?

  • Workload
  • Amount of processing for

computer to do

  • Consists of some amount
  • f application programs
  • Can contain some number
  • f users interacting with

the program

6

  • Benchmark
  • Designed to mimic a

particular type or workload

  • Single Tier
  • Two Tier
  • Multi Tier
  • SPEC benchmarks
slide-4
SLIDE 4

10/21/2015 4

System Technologies and Optimization

SPEC Benchmarks

  • The Standard Performance Evaluation Corporation
  • Non-profit corporation
  • Establish, maintain and endorse a standardized set of relevant

benchmarks

  • Review and publish submitted results
  • Examples:
  • Single-tier: SPECjbb2005, SPECjvm2008, SPECjbb2015
  • Multi-tier: SPECjEnterprise2010, SPECsip2007

7

System Technologies and Optimization

Platform Monitoring

  • Throughput focuses on maximizing

the amount of work by an application in a specific period of time. Examples of how throughput might be measured include:

  • The number of transactions

completed in a given time.

  • The number of jobs that a batch

program can complete in an hour.

  • The number of database queries

that can be completed in an hour.

8

  • Responsiveness refers to how

quickly an application or system responds with a requested piece of

  • data. Examples include:
  • How quickly a desktop UI

responds to an event

  • How fast a website returns a

page

  • How fast a database query is

returned

slide-5
SLIDE 5

10/21/2015 5

System Technologies and Optimization

System Activity Monitoring

  • System Activity Report (sar)
  • Unix System V-derived system monitor command
  • report on various system loads
  • CPU activity
  • memory/paging
  • device load
  • network
  • Linux distributions provide sar through the sysstat package.

9

System Technologies and Optimization

CPU Monitoring

  • Hardware Performance Counters
  • CPU hardware registers that count hardware events
  • instructions executed, cache-misses suffered, or branches mispredicted….
  • They form a basis for profiling applications to identify hotspots.
  • perf
  • a tool for using the performance counters subsystem in Linux
  • provides rich generalized abstractions over hardware specific capabilities.
  • provides per task, per CPU and per-workload counters, sampling on top of these and source

code event annotation.

10

slide-6
SLIDE 6

10/21/2015 6

System Technologies and Optimization

User Experience Monitoring

  • Faban:
  • Free and open source framework
  • Load generator:
  • Simulate different user scenarios
  • Simulate transactions
  • Engineers can use this framework to
  • create workload
  • evaluate software/hardware platform

11

System Technologies and Optimization

What is Analytics?

  • Analytics is important to extract patterns from data.
  • Analytics provides principled guidance for design of experiment.
  • Useful statistical and optimization techniques come in handy
  • Examples of Analytics applied in performance analysis:
  • Used in developing adaptive changes in hardware from

monitoring hardware performance counters

  • Used for datacenter performance

12

slide-7
SLIDE 7

10/21/2015 7

System Technologies and Optimization

Some examples of statistical approaches

  • Hypothesis testing:
  • a procedure to establish whether two or more datasets have certain
  • relationships. e.g., mean, median, variance comparison. t-test.
  • Regression analysis:
  • a statistical process to estimate the relationship among variables. Widely

used for prediction and forecasting. e.g., linear regression, response surface methods.

  • Dimension reduction:
  • a procedure to reduce complexity. e.g., principal component analysis

13

System Technologies and Optimization

Mathematical Optimization

  • A mathematical procedure to

maximize/minimize a real function.

  • Linear programming, quadratic programming,

convex optimization etc.

14

slide-8
SLIDE 8

10/21/2015 8

System Technologies and Optimization

Some basics in machine learning

  • Supervised learning
  • predict the labels of test data after learning from the training data.
  • K-nearest neighbor, logistic regression, random forest, neural network.
  • Unsupervised learning:
  • group data points into clusters based on certain choices of similarities.
  • K-means, hierarchical clustering, expectation-maximization.

15

System Technologies and Optimization

What is Cloud Computing?

According to the definition of Cloud Computing by the National Institute of Standards and Technology (NIST), “Cloud computing is a model of enabling ubiquitous, convenient, on-demand network access to a shared pool of configurable computing resources that can be rapidly provisioned and released with minimal management effort or service provider interaction.” Examples of cloud computing models: Software-as-a-service (SaaS), Platform- as-a-service (PaaS), Infrastructure-as-a-service (IaaS).

16

slide-9
SLIDE 9

10/21/2015 9

System Technologies and Optimization

Current Challenges

  • Manually examining lots
  • f cloud performance data

is impossible.

  • Thousands of VMs running in

the cloud

  • Even more number of

workloads running in the cloud.

  • Data is of high volume and

very messy.

17

  • After data merging and

processing, a lot more analysis can be done:

  • Time series analysis
  • Correlation analysis
  • Pattern discovery
  • Regression analysis

System Technologies and Optimization

Data from Different Sources are Messy

  • Unify multiple data sources of different formats
  • Different data sources have different time formats
  • World clock
  • Epoch
  • Time zones
  • Units measurements
  • Some data are log files

18

slide-10
SLIDE 10

10/21/2015 10

System Technologies and Optimization

Cloud + Performance Data + Analytics How to connect the dots?

Our Contribution:

  • We propose an approach
  • to merge data from multiple sources
  • to assess the quality of cloud performance data

19

System Technologies and Optimization

Assess the quality of cloud performance

  • We propose a process, implemented in software, to assess the

quality of cloud performance data.

  • Combine performance data from multiple machines:
  • user experience: obtained from typical load driver systems
  • workload performance metrics
  • system performance data: obtained from System Activity

Report (SAR) or Performance Counters for Linux (Perf)

20

slide-11
SLIDE 11

10/21/2015 11

System Technologies and Optimization

Assessing Analytics Quality for Cloud Performance

21

Multiple Platforms for Processing Check raw data Quality

raw data Quality

Raw Data Check Processing Quality Compute Statistics Posterior Analysis R, R studio Python Layer1 Layer 2 Layer 3

System Technologies and Optimization

A Cloud Workload Case Study

  • A Cloud Workload
  • SaaS workload composed of several Java applications serving requests

in a group of domains.

  • Workload driven by five groups of users simulated on the driver.
  • Each user group simulates a particular type of users, sending a

sequence of requests to the service.

  • Upon receiving the response to a request, each virtual user waits for a

period of time, called the think time, before sending the subsequent request.

  • Different number of virtual users are assigned to each user group.

22

slide-12
SLIDE 12

10/21/2015 12

System Technologies and Optimization

A Demonstration of the Cloud Workload

23

Request Request Response

Workload Driver Task1 Group A Group B Group E Cloud Computing Simulated Users Task 2 Task 3 Task 4

Response

JVM Processes

System Technologies and Optimization

Performance Data Collection

  • Two machines: web server and client server.
  • Client server: hosts an application driver to generate workload.
  • Web server: receives requests from client server.
  • Interaction: client server increases the load by ramping up the number of

virtual users interacting with the server.

  • Data collection:
  • Server: Java garbage collection.
  • Driver: user experience, response time, failed transactions etc.
  • System level (determined by OS): CPU, I/O, memory, network.

24

slide-13
SLIDE 13

10/21/2015 13

System Technologies and Optimization

Performance Data Processing

  • Sources of Data and Original Formats:
  • System Activity Report (SAR)
  • T by N table on CPU utilization, I/O, memory, network.
  • Sampling interval specified by performance engineers
  • Garbage Collection (GC)
  • Human-readable log files on heap size, pause time, memory.
  • Time stamps are random based on JVM.
  • Parsed using Python.
  • Client Server:
  • T by N table on response time, number of fails, performance.

25

System Technologies and Optimization

Performance Data Processing

  • Processing and Merging Data
  • Challenges:
  • Different formats of data.
  • Different time stamps.
  • Merging technique:
  • Python to parse GC.
  • R to parse user experience data from client server.
  • Convert all time stamps to epoch milliseconds.

26

Our tool is the first tool to enable cloud workload characterization from system, applications and client perspectives.

slide-14
SLIDE 14

10/21/2015 14

System Technologies and Optimization

Performance Data Profiling and Analytics

  • What analysis can be done on a coherent

dataset?

  • Missing value imputation: missing values are artificially introduced due to

time stamp merging.

  • Data profiling: profile the performance metric by calculating the mean,

median, minimum, maximum, range, percentile.

  • Correlation analysis: examine the intrinsic relationship between GC, OS,

and client server.

27

System Technologies and Optimization

Assess Performance Analytics Quality

  • Discrepancies in data processing sometimes are

difficult to spot.

  • High-dimensional data is usually noisy.
  • Our software implements two independent scripts

in parallel to process the same cloud performance data.

  • We ensure entry-by-entry consistency as well as

attribute names and ordering consistency.

28

slide-15
SLIDE 15

10/21/2015 15

System Technologies and Optimization

Summary and Discussion

  • Analysis on cloud performance has an immerse impact
  • n cloud computing environment.
  • Analysis is difficult due to raw data formats.
  • We propose a software that transforms the raw data into

conventional data formats, ready for principled analytics.

  • We have established a methodology to evaluate and

improve the quality of the analytics used for cloud performance assessment.

29