
SLIDE 1
BLLAST Uniform processing of EC data Olivier De Coster & Henk - - PowerPoint PPT Presentation
BLLAST Uniform processing of EC data Olivier De Coster & Henk Pietersen Supervised by F. Lohou, O. Hartogensis & A. Moene Content INTERNSHIP Experimental Set-up EC-stations Data Processing Scintillometer Analysis THESIS
Overview MicroSite (20 Hz)
Valimev tower (10 Hz)
SkinFlow mast (20 Hz)
T-couple
MicroSite
University of Bergen
SkinFlow mast
University of Utah & Wageningen University
Valimev tower
Laboratoire d’Aérologie
SkinFlow MicroSite Valimev
Overview Forest mast (10 Hz)
Corn (20 Hz)
Moor (20 Hz)
Moor
Météo-France
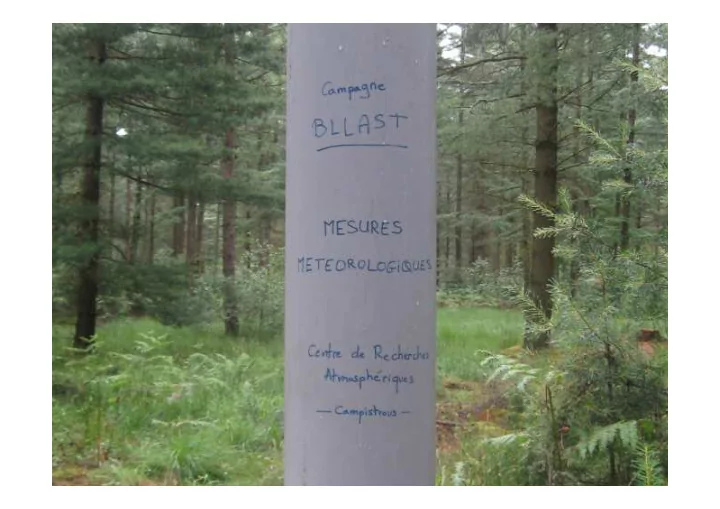
Forest mast
University of Utah & Wageningen University
Corn
Météo-France
Forest Moor Corn
EDGE SITE Grass (20 Hz)
Edge (20 Hz)
Wheat (20 Hz)
Edge
Wageningen University
Wheat
University of Bonn
Grass
Forschungszentrum Jülich & Bonn University
www.met.wau.nl/ projects/csi2ncdf/index.htm l www.met.wau.nl/ projects/jep/index.html STEP 1: Organizing Raw Data STEP 2: Rotation Correction STEP 3: Flux Calculation
Divergence site (SkinFlow) Forest site Surface energy balance stations corn site 2 Surface energy balance stations moor site 2 Meteorological parameters Edge Site Micrometeo parameters
Small: Use full BLLAST period Large: Use weekly periods
PROCES COMMENTS
Averaging Block averaging 5, 10, 30 minutes Rotation Planar fit (Wilczack et al., 2001) Mean(V) 0 yes Time-lag yes/no Despiking no Rejection non-physical values yes Poor frequency response yes (Moore, 1986) Webb correction yes (Webb et al., 1980) O2 correction Krypton yes (Tanner et al., 1993) Sonic T correction yes (Schotanus et al., 1983)