
SLIDE 1
11/5/19 1
Biomarkers in Immune-Oncology
November 9, 2019
David Spetzler, MS,MBA, PhD President and Chief Scientific Officer Caris Life Sciences
1
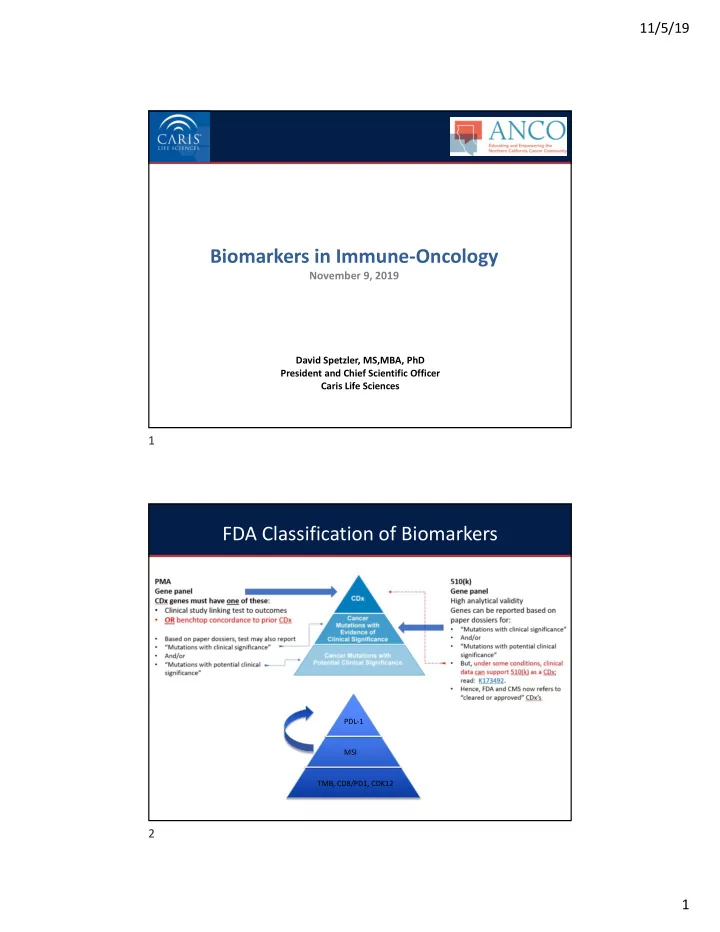
FDA Classification of Biomarkers
PDL-1 MSI TMB, CD8/PD1, CDK12
Biomarkers in Immune-Oncology November 9, 2019 David Spetzler, - - PDF document
11/5/19 Biomarkers in Immune-Oncology November 9, 2019 David Spetzler, MS,MBA, PhD President and Chief Scientific Officer Caris Life Sciences 1 FDA Classification of Biomarkers PDL-1 MSI TMB, CD8/PD1, CDK12 2 1 11/5/19 3 Complex State
David Spetzler, MS,MBA, PhD President and Chief Scientific Officer Caris Life Sciences
PDL-1 MSI TMB, CD8/PD1, CDK12
3
PD-L1 antibody IO Therapy SP142 (Ventana) Atezoluzumab (Roche) SP263 (Ventana) Durvalumab (Astrazeneca) 22c3 (Dako) Pembrolizumab (Merck) 28-8 (Dako) Nivolumab (BMS) 73-10 (Dako) Avelumab (Merck KGaA) Non-small cell lung cancer (NSCLC) Complementary Threshold: TC ≥50% or IC ≥10%
TPS ≥1 Complementary Threshold: TC ≥1% (increasing benefit for 5% and 10%)
Companion Threshold: IC ≥5% (IC2/3) Complementary Threshold(s): TC ≥25% (membranous), or ICP >1% and IC ≥25%, or ICP =1% and IC = 100% Companion Threshold: CPS ≥10 Complementary Threshold: TC ≥1% Threshold: TC ≥5% Melanoma Threshold: ≥1%
carcinoma (HNSCC)
Threshold: CPS ≥1 Complementary Threshold: TC ≥1%
Gastric and Gastroesophageal Junction (GE/GEJ)
Threshold: CPS ≥1
Threshold: CPS ≥10
Threshold: CPS ≥1
Companion IC ≥1% (IC1/2/3)
CPS ≥1
N Engl J Med 2018; 378:2078-2092 DOI: 10.1056/NEJMoa1801005
N Engl J Med 2018; 378:2078-2092 DOI: 10.1056/NEJMoa1801005
8
Le et al. Science 2017
N Engl J Med 2015; 372:2509-2520 DOI: 10.1056/NEJMoa1500596
N Engl J Med 2015; 372:2509-2520 DOI: 10.1056/NEJMoa1500596
1 6
Le et al. Science 2017
Tamiya (2005). Human molecular genetics. 14. 2305-21. 10.1093/hmg/ddi234.
388 MSI PD-L1 TMB 886 252 64 3124 14942 2163
TMB High and MSI High vs. PD-L1 positive cases
MSI PD-L1 TMB 108 1286 42404 7 1860 34694 19160
All TMB, MSI and PD-L1 tested cases
Cytotoxic and memory T cells associate with favorable prognosis
Fridman 2012 Nature Reviews: Cancer
Immunoscore was proposed as a method of classifying tumors by quantifying in situ T cells and cytotoxic T cells
Immunoscore
CD3+ density/location CD8+ density/location
The densities of CD3+ and CD8+ T cells are determined in the tumor center and invasive margin regions Type, Density, and Location of Immune Cells Within Human Colorectal Tumors Predict Clinical Outcome
Galon 2012 Journal of Translational Medicine Galon 2006 Science
CT IM
2 2
Disease-free survival according to the Immunoscore in patients with stage I–III colon cancers. Immunoscore was stronger than all these clinical parameters at predicting survival and risk of recurrence
Pages et al. 2018. Lancet Pages et al. 2018. Lancet Pages et al. 2018. Lancet
Immunoscore has high-degree of predictive capacity
Strong prognostic role of stromal TILs in early-stage TNBC
23
Denkert 2018 Lancet
TIL concentration and response to neoadjuvant combination chemotherapy
Stromal TILs were quantified on H&E sections of core biopsies obtained before the start of neoadjuvant chemotherapy.
N = 3771 patients
Stromal TILs were quantified on H&E sections from patients with early stage TNBC treated with anthracycline-based chemotherapy with or without taxanes
Loi 2019 Journal of Clinical Oncology
Have expanded standardized scoring of TILs to:
(Hendry 2017 Adv Anat Pathol. )
pathological complete response
Mella et al. 2015. OncoImmunology
Prostate carcinoma Renal cell carcinoma
Ness et al. 2014. The Prostate
Plausible explanations
TH2, TH17 )
molecules, immunosuppressive cytokines)
NCT03651271; currently recruiting for Advanced Metastatic Cancer
25
This study will shed light on ‘hot’ vs ‘cold’ tumors by evaluating:
cells using CyTOF
sequencing
responsiveness to treatment
Predictive biomarkers for response to immunotherapy
MMRd/MSI-H Peripheral blood and microbiome TIL landscape
2019
TMB TiME and functional state
2015
PD-L1 expression
2012 2017
First of its kind – treatment stratified by CD8+ T cell density
Currently: only approximately 20%–40% of patients benefit from checkpoint inhibition
immunotherapy efficacy are needed
Rizvi et al. 2015 Science Le et al. 2017 Science Topalian et al. 2012 N. Engl. J. Med. Brahmer et al. 2012 N. Engl. J. Med. &
– Proximity between individual cells (i.e. spatial relationships)
Adapted from Tsujikawa et al. 2017. Cell Reports
Landscape/functional multiplex IHC panel: 6-plex + Tumor marker + DAPI
Marker Present on TiME function CD3 Pan T lymphocytes (effector, helper, cytotoxic, memory, regulatory, NK-T, γδ) Cell-mediated immunity CD8 CD3+CD8+ (Cytotoxic T cells) CD3+CD8- (Helper T cells) Cytotoxic - Tumor killing Helper – regulate immune response CD163 M2 Macrophages (TAMs) Direct and indirect suppression of T cell function and recruitment Hypoxia / fibrosis FoxP3 Regulatory T cells Maintain immune homeostasis Suppress anti-tumor immunity PD-1
Inhibits T cell proliferation, survival, and effector function Decreases expression of survival molecules PD-L1 T cells B cells DCs APCs MDSCs Tumor cells Same as PD-1
Hot tumors
infiltration
Cold tumors
and at the tumor margins Altered-immunosuppressed tumors
(or bordered at tumor margin)
macrophages, regulatory T cells)
28 open clinical trials targeting TAMs in combination with anti-PD-1/PD-L1 therapy -
as of 04/24/19
Orabona 2018
1. CD3 – landscape - Pan-T cells 2. CD8 – landscape – Cytotoxic T cells 3. PD-1 – function – T cell exhaustion 4. PD-L1 – function – T cell exhaustion 5. TIM-3 – function – T cell exhaustion 6. LAG-3 – function – T cell exhaustion Immunomodulatory targets in active clinical trials T cell functional state multiplex IHC panel:
LAG-3
TIM-3
6-plex + Tumor marker + DAPI
NCT01968109 - anecdotal proof of principal
Patients with solid tumors that progressed on anti- PD-1/PD-L1 therapy were treated with Anti-LAG-3 (BMS-986016) + Nivo
control rate of 49%.
1% at baseline, the ORR was 18%; in the subgroup of these patients that also showed PD-L1 expression <1%, the ORR was 27%
Active TIM-3 and LAG-3 clinical trials:
29
Bethmann 2018 Current opinion in Immunology
improve reproducibility of multiplex staining and allow for CLIA standards, so that multiplex staining can be used to make clinical decisions.
will aid to interpret data from tissue and lead to improved delivery of precision medicine.
The effectiveness of immunomodulatory strategies is inherently dependent on the presence of tumor-associated (or circulating) immune components
30
Mazzaschi et al, 2017
31
CDK12-CyclinK complex bound to AMPPNP
32
Dixon-Clarke et al. 2015
– Suggests potential protein interaction partners from a wide range of signaling pathways
Liu et al. 2018 (review)
33
Liu et al. 2018 (review) CDK12-cyclin K complex
– Expression and alternative last exon (ALE) splicing
– Alteration of 2.67% of tested genes (microarray)
– Enrichment of genes involved in DNA replication, recombination and repair centered on the BRCA1 module. Significantly lower levels of BRCA1, ATR, FANCI and FANCD2. – CDK12 required for optimal pre-mRNA processing of the MYC gene, with gene depletion reducing levels of polyadenylated MYC RNA
– Suggests CDK12/cyclin K is a master regulator of proteins specifically involved in DNA damage repair (DDR) and response to DNA damage
34
Liu et al. 2018 (review)
35
Wu et al. 2018
36
– No germline aberrations were detected
Wu et al. 2018
37
Wu et al. 2018 Quigley et al. 2018
38
Wu et al. 2018
39
Wu et al. 2018
40
were defined as:
a) mutations with loss of heterozygosity (LOH) at the wild-type allele, as determined by zygosity status b) copy number loss (homozygous deletion) c) ≥2 CDK12 GAs in a given sample
41
Cancer types with N > 50 CDK12-MT cases
42
tumor profile, all gene fusion events can be detected and mapped back to the genome to assess the changes in genome structure
immune epitopes to identify antigenic peptides that may invoke an immune response
across multiple cancer types to evaluate the potential of CDK12 as pan-tumor biomarker of response to IO therapy
0.0% 1.0% 2.0% 3.0% 4.0% 5.0% 6.0% 7.0% A l l ( 2 2 ) P r
t a t e ( 1 1 ) S a l i v a r y G l a n d ( 1 ) O v a r i a n ( 6 ) G a s t r i c ( 1 ) E s
h a g e a l ( 1 ) C
e c t a l ( 1 ) L u n g , N S C L C ( 1 ) U t e r i n e N e
l a s m s ( ) M e l a n
a ( ) N e u r
n d
r i n e ( ) S m a l l I n t e s t i n e s ( ) B r e a s t ( ) C h
a n g i
a r c i n
a ( ) B l a d d e r , u r
h e l i a l ( ) K i d n e y ( ) H e a d & N e c k ( ) U n k n
n P r i m a r y ( ) S
t T i s s u e ( ) H i g h G r a d e G l i
a ( ) P a n c r e a t i c ( )
Alteration Frequency Cancer Type
Prevalence of CDK12 Alterations in Caris Database
CDK12 Monoallelic L OF CDK12 Biallelic LOF
genomic structural variant phenotype characterized by focal tandem duplication events
(Adapted from Wu et al., 2018)
– CDK12 subgroup = CDK12-Biallellic LOF – Multiple subgroup = cases with various combination of biomarker alterations – Pan-WT subgroup: cases lacking alterations for each biomarker listed
subgroup
fusion rates
– Suggests additional driver mutations of high fusion rate remain to be discovered
Biomarker Subgroups Fusions Detected
– Peptide libraries generated from fusion sequences for each fusion isoform detected by WTS – HLA genotyping performed to enable prediction of HLA allele-specific affinities for each peptide – Interpretation of peptide affinities based on guidelines reported by IEDB:
intermediate affinity. Some epitopes have low affinity, but no known T-cell epitope has an IC50 value greater than 5000”
Fusions Detected High Affinity Peptides (IC50 < 50 nM)
46
CarisLifeSciences.com twitter.com/CarisLS facebook.com/CarisLifeSciences linkedin.com/company/caris-life-sciences