Belgrave Investment Proposal Raise US$50 million equity - - PDF document

belgrave investment proposal
SMART_READER_LITE
LIVE PREVIEW

Belgrave Investment Proposal Raise US$50 million equity - - PDF document

5/12/15 Belgrave Investment Proposal Raise US$50 million equity Invest in well located Dublin Residential Property Private and Confidential. Max


slide-1
SLIDE 1

5/12/15 1

Private ¡and ¡Confidential. ¡ May ¡2015 ¡

Belgrave – May 2015

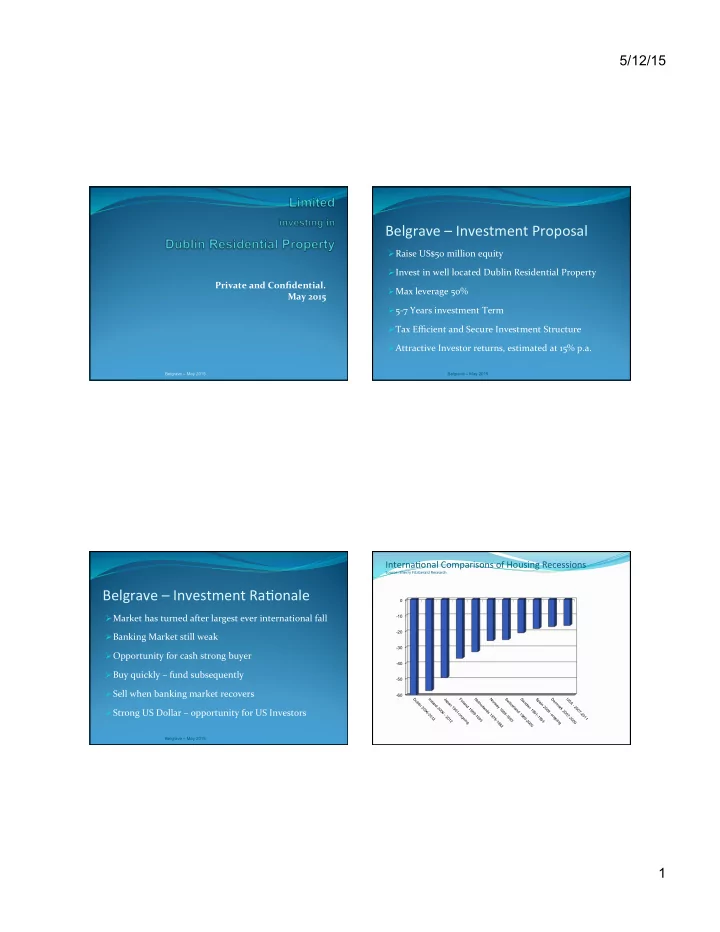
Belgrave ¡– ¡Investment ¡Proposal ¡

Ø Raise ¡US$50 ¡million ¡equity ¡ ¡ Ø Invest ¡in ¡well ¡located ¡Dublin ¡Residential ¡Property ¡ Ø Max ¡leverage ¡50% ¡ Ø 5-­‑7 ¡Years ¡investment ¡Term ¡ Ø Tax ¡Efficient ¡and ¡Secure ¡Investment ¡Structure ¡ Ø Attractive ¡Investor ¡returns, ¡estimated ¡at ¡15% ¡p.a. ¡

Belgrave – May 2015

Belgrave ¡– ¡Investment ¡Ra3onale ¡

Ø Market ¡has ¡turned ¡after ¡largest ¡ever ¡international ¡fall ¡ Ø Banking ¡Market ¡still ¡weak ¡ Ø Opportunity ¡for ¡cash ¡strong ¡buyer ¡ Ø Buy ¡quickly ¡– ¡fund ¡subsequently ¡ Ø Sell ¡when ¡banking ¡market ¡recovers ¡ Ø Strong ¡US ¡Dollar ¡– ¡opportunity ¡for ¡US ¡Investors ¡

Belgrave – May 2015

Interna3onal ¡Comparisons ¡of ¡Housing ¡Recessions ¡

Source: ¡Sherry ¡FitzGerald ¡Research ¡

  • 60
  • 50
  • 40
  • 30
  • 20
  • 10
slide-2
SLIDE 2

5/12/15 2

5

Dublin ¡Second ¡Hand ¡Market ¡ ¡

— Dublin ¡Market ¡rose ¡by ¡18% ¡in ¡12 ¡months ¡to ¡ December ¡2014 ¡

0 ¡ 100 ¡ 200 ¡ 300 ¡ 400 ¡ 500 ¡ 600 ¡ 700 ¡ 800 ¡ Q4 ¡1996 ¡ Q2 ¡1997 ¡ Q4 ¡1997 ¡ Q2 ¡1998 ¡ Q4 ¡1998 ¡ Q2 ¡1999 ¡ Q4 ¡1999 ¡ Q2 ¡2000 ¡ Q4 ¡2000 ¡ Q2 ¡2001 ¡ Q4 ¡2001 ¡ Q2 ¡2002 ¡ Q4 ¡2002 ¡ ¡ Q2 ¡2003 ¡ Q4 ¡2003 ¡ Q2 ¡2004 ¡ Q4 ¡2004 ¡ Q2 ¡2005 ¡ Q4 ¡2005 ¡ Q2 ¡2006 ¡ Q4 ¡2006 ¡ Q2 ¡2007 ¡ Q4 ¡2007 ¡ Q2 ¡2008 ¡ Q4 ¡2008 ¡ Q2 ¡2009 ¡ Q4 ¡2009 ¡ Q2 ¡2010 ¡ Q4 ¡2010 ¡ Q2 ¡2011 ¡ Q4 ¡2011 ¡ Q2 ¡2012 ¡ Q4 ¡2012 ¡ Q2 ¡2013 ¡ Q4 ¡2013 ¡ Q2 ¡2014 ¡ Q4 ¡2014 ¡ Index ¡Base ¡Year ¡-­‑ ¡Q4 ¡1995 ¡

Irish ¡Mortgage ¡Lending ¡

Ø Peak ¡2006 ¡ ¡-­‑ ¡ ¡€40 ¡billion ¡ ¡ Ø 2011 ¡– ¡2013 ¡: ¡Approx. ¡€2.5 ¡billion ¡p.a. ¡ Ø 2014 ¡ ¡-­‑ ¡ ¡€3.9 ¡billion ¡ Ø Normal ¡Market ¡expectation: ¡€8 ¡to ¡€10 ¡billion ¡ Ø Market ¡missing ¡over ¡50% ¡of ¡it’s ¡purchasing ¡power! ¡

Belgrave – May 2015

7

Mortgage Draw-downs 2005-2014*

0 ¡ 20,000 ¡ 40,000 ¡ 60,000 ¡ 80,000 ¡ 100,000 ¡ 120,000 ¡ 2 5 ¡ 2 6 ¡ 2 7 ¡ 2 8 ¡ 2 9 ¡ 2 1 ¡ 2 1 1 ¡ 2 1 2 ¡ 2 1 3 ¡ Y T D ¡ Q 3 ¡ 2 1 4 ¡ Units ¡

* Data excludes top-up mortgages Source: IBF

Belgrave ¡– ¡Investment ¡Strategy ¡

Ø Buy ¡in ¡well ¡located ¡areas ¡of ¡Dublin ¡only ¡ Ø Family ¡Homes ¡– ¡3, ¡4 ¡and ¡5 ¡bed ¡houses, ¡with ¡gardens ¡ Ø Small ¡sites ¡for ¡development ¡– ¡funding ¡opportunities ¡ Ø Distressed ¡Apartment ¡blocks ¡in ¡central ¡Dublin ¡ ¡ Ø Exit ¡when ¡market ¡recovers ¡– ¡5 ¡to ¡7 ¡years. ¡ ¡

Belgrave – May 2015

slide-3
SLIDE 3

5/12/15 3

9

Housing ¡Comple3ons ¡1973-­‑2014 ¡

LT average: 33,400 units

Dublin ¡Popula3on ¡and ¡Jobs ¡Growth ¡

Ø 2011 ¡Dublin ¡Population ¡1.27 ¡Million ¡ ¡ Ø Growing ¡by ¡approx. ¡25,000 ¡per ¡annum ¡ Ø 17,000 ¡new ¡jobs ¡created ¡in ¡Dublin ¡in ¡2014 ¡ ¡ Ø 2015 ¡new ¡jobs ¡expected ¡to ¡exceed ¡2014 ¡

¡ Source: ¡CIF ¡

Belgrave – May 2015 Belgrave – May 2015

12

Future ¡Demand, ¡Demographic ¡Projec3ons ¡-­‑ ¡Dublin ¡

Year Housing Demand

2012-16 6.300 2016-21 11,700 2021-26 10,100 Average PA 9,700

slide-4
SLIDE 4

5/12/15 4

13

Economy, ¡An ¡Overview ¡

— ¡ ¡ ¡ ¡ ¡GDP ¡growth ¡of ¡4.7% ¡in ¡2014 ¡

% Change 2011 2012 2013 2014 2015 f 2016 f 2017 f 2018 f

Real GNP

  • 1.6%

1.8% 3.3% 4.1% 3.6% 3.1% 3.1% 3.1% Real GDP 2.2% 0.2% 0.2% 4.7% 3.9% 3.4% 3.4% 3.4% Exports 5.4% 1.6% 1.1% 8.3% 4.8% 4.3% 4.3% 4.7% Investment

  • 2.9%

5.0%

  • 2.4%

14.6% 12.7% 7.6% 7.5% 5.1% Consumption

  • 1.6%
  • 0.3%
  • 0.8%

1.7% 2.7% 1.4% 1.3% 1.3% Unemployment Rate 14.6% 14.7% 13.1% 11.4% 10.2% 9.4% 8.9% 8.1%

Source: Department of Finance

The ¡Irish ¡Economy ¡

Ø FDI ¡is ¡key ¡to ¡Irish ¡Economy ¡

Ø Low ¡Corporate ¡Tax ¡Rate ¡of ¡12.5% ¡ Ø Industry ¡Focused ¡Education ¡System ¡

Ø Strong ¡Industries: ¡

Ø Technology ¡– ¡8 ¡of ¡world’s ¡top ¡10 ¡Tech ¡Companies ¡ Ø Pharma ¡-­‑ ¡9 ¡of ¡the ¡World’s ¡top ¡10 ¡Pharma ¡Companies ¡ Ø Financial ¡Services ¡-­‑ ¡Over ¡€2.2 ¡Trillion ¡in ¡Funds ¡ Ø Agriculture ¡and ¡Food ¡– ¡Growing ¡and ¡strengthening ¡ Ø Tourism ¡– ¡Weak ¡Euro ¡boosting ¡Tourism ¡

¡

Belgrave – May 2015

Assump3ons ¡/ ¡Returns ¡

Ø Assumed ¡Value ¡Recovery ¡of ¡50% ¡over ¡7 ¡years ¡

Ø Projected ¡2021 ¡Values ¡– ¡still ¡15% ¡below ¡2006 ¡Peak ¡ Ø Reflects ¡annual ¡inflation ¡of ¡3.6% ¡since ¡2000 ¡

Ø Results ¡in ¡Investor ¡IRR ¡of ¡approx ¡15% ¡ Ø Estimated ¡Investor ¡return ¡– ¡2 ¡plus ¡multiple ¡

Belgrave – May 2015

Tax ¡Efficient ¡Investment ¡Structure ¡

Ø Qualified ¡Investor ¡Alternative ¡Investment ¡Fund ¡(QIAIF) ¡

Ø Regulated ¡by ¡CBI ¡– ¡Irish ¡Financial ¡Regulator ¡ Ø Funds ¡held ¡by ¡Custodian ¡Bank ¡ Ø QIAIF ¡managed ¡by ¡leading ¡Irish ¡Stockbroker ¡ Ø KPMG ¡Auditors ¡

Ø No ¡Irish ¡Taxes ¡(Income, ¡Capital ¡or ¡Inheritance) ¡ Ø Focused ¡on ¡Foreign ¡Investors ¡ ¡

Belgrave – May 2015

slide-5
SLIDE 5

5/12/15 5

The ¡Belgrave ¡Team ¡

Ø Ian ¡McCarthy ¡– ¡CEO ¡ Ø Kevin ¡Donovan ¡– ¡Chairman ¡ Ø Martin ¡Connor ¡– ¡CFO ¡ Ø Andrew ¡O’Kelly ¡– ¡Development ¡Director ¡ ¡

Belgrave – May 2015

Why ¡Belgrave? ¡

Ø Strong, ¡qualified ¡Management ¡Team ¡ Ø Only ¡such ¡investment ¡offering ¡ Ø Tax ¡efficient ¡investment ¡structure ¡ Ø Highest ¡levels ¡of ¡probity ¡

Ø KPMG ¡Auditors ¡ Ø US ¡Custodian ¡Bank ¡holds ¡all ¡funds ¡and ¡securities ¡ Ø Regular ¡reporting ¡

Belgrave – May 2015

Next ¡Steps ¡

Ø Indicate ¡interest ¡to ¡Belgrave ¡

Ø Information ¡Memorandum ¡will ¡follow ¡ Ø Irish ¡Regulated ¡Stockbroker ¡process ¡ Ø Investment ¡funds ¡to ¡Custodian ¡Bank ¡

Belgrave – May 2015