BEAM Detector Detector POWER x-ray laser - Focus e Final D - - PowerPoint PPT Presentation

beam
SMART_READER_LITE
LIVE PREVIEW

BEAM Detector Detector POWER x-ray laser - Focus e Final D - - PowerPoint PPT Presentation

jector e Superconducting Collider + e Linear e+ Target damping ring Accelerator linear accelerator Positron Pre-damping and Damping R ing e+ Focus Final rator H igh E nergy L ow E nergy BEAM Detector Detector POWER x-ray


slide-1
SLIDE 1

Superconducting Linear Accelerator Collider

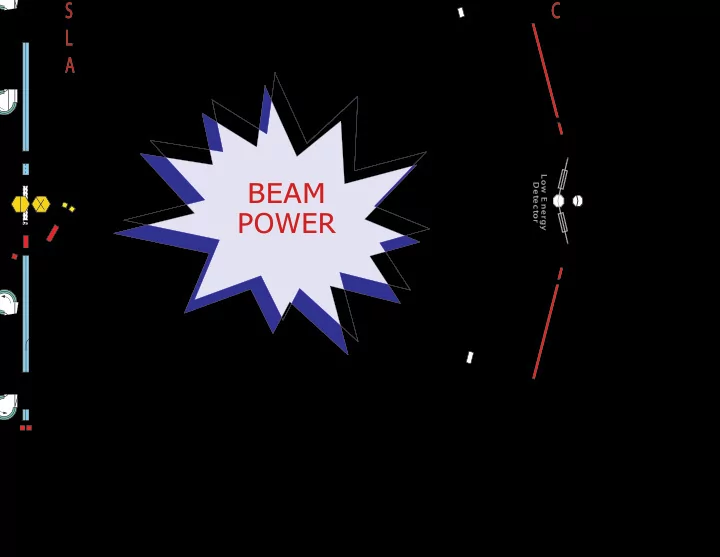
e+ e+ Target Positron Pre-damping and Damping R ing e– jector e – e – I n j e c t

  • r

E l e c t r

  • n

D a m p i n g R i n g Final Focus H igh E nergy Detector L ow E nergy Detector Final Focus

electron sources

  • (HE P and x-ray laser)

linear accelerator linear accelerator damping ring damping ring x-ray laser

  • rator

e

e

+

e

BEAM

POWER

Chris Adolphsen

slide-2
SLIDE 2

Luminosity (L) and Beam Power (Pbeam)

εy = Normalized Vertical Emittance at IP

L ~ Pbeam / (εy)1/2

For NLC & TESLA, L Scales Approximately as

where Pbeam = Linac Wall Plug Power (Limited to a Few 100 MW) × AC -to- Beam Efficiency (Function of RF Technology) = Ne: Number of e+/e− per Bunch × Nb: Number of Bunches Per Pulse × frep: Pulse Repetition Rate × Eb: Final Beam Energy

slide-3
SLIDE 3
  • Normal-Conducting RF Accelerator Structures

– Want high RF frequency to be efficient with lower RF energy per pulse (thus fewer rf components) and higher gradient (thus a shorter linac).

  • Downside is higher wakefields and thus tighter alignment tolerances.

– NLC/JLC uses 11.4 GHz RF.

  • NLC cost is optimum with an unloaded gradient of 70 MV/m.

– CLIC uses 30 GHz RF.

  • The 3 TeV collider design requires 170 MV/m unloaded gradient.
  • Super-Conducting RF Accelerator Cavities

– Exploit low cavity losses to deliver energy to beam efficiently and slowly, so less expensive, low peak power sources can be used.

  • Downside is the large damping rings required for the long bunch trains.

– TESLA operates at 1.3 GHz based on surface resistance – cavity size tradeoff.

  • Design gradient of 23 MV/m based on initial site plan: cost optimum higher.

Linear Collider RF Technologies

slide-4
SLIDE 4

HOM Manifold Accelerator Cell (Iris

  • Dia. = 11.2-7.8 mm)

RF Input Beam

Two RDDS Cells

NLC/JLC Rounded Damped-Detuned Structure (RDDS)

Made with Class 1 OFE Copper. Cells are Precision Machined (Few µm Tolerances) and Diffusion Bonded to Form Structures. 1.8 m Length Chosen so Fill Time ª Attenuation Time ª 100 ns. Operated at 45 °C with Water Cooling. RF Losses are about 3 kW/m. RF Ramped During Fill to Compensate Beam Loading (21%). In Steady State, 50% of the 170 MW Input Power goes into the Beam.

slide-5
SLIDE 5

TESLA Cavities

  • Made with Solid, Pure Niobium (Weak Flux Pinning)
  • Nb Sheets are Deep-Drawn to Make Cups, which are E-Beam Welded

to Form Cavities.

  • Cavity Limited to Nine Cells (1 m Long) to Reduce Trapped Modes,

Input Coupler Power Losses and Sensitivity to Frequency Errors.

  • Operated at 1.8-2 K in Superfluid He Bath (Surface Resistance Very

Sensitive to Contaminates and Temperature: Increases 50 fold at 4.2 K). RF losses (Q0 ≈ 1010) are ≈ 1 W/m.

  • Qext Adjusted to Match Beam Loading (Qbeam ≈ 3×10 6). In Steady State,

Essentially 100% of the 230 kW Input Power Goes into the Beam. Cavity Fill Time = 420 µs.

slide-6
SLIDE 6

S ource (mW) Phase S hifter

R F Distribution (Compression in NLC Only) (85% vs 94%) Accelerator S tructure (30% vs 63% R F-to-Beam including Overhead) Modulator (80% vs 85%) Cooling (15 vs 21 MW) & Other (3 vs 8 MW) Klystron (55% vs 65%) w Level R F

R F Pulse

(NLC vs TE S LA E fficiencies and Average Power)

Beam

vs 97 MW 13 vs 23 MW ... AC-to-Beam E fficiency NLC: 10% TE S LA: 24%

slide-7
SLIDE 7

LC Linac R F Unit

vel R F S ystem 0 kV 3-Turn Induction Modulator KW TWT Klystron Drivers (not shown) MW PPM Klystrons ine Distribution S ystem (2 Mode, 4 Lines) ccelerator S tructure S extets

ns MW S ingle Mode E xtractor Beam Direction .6 m S ix 0.9 m Accelerator S tructures (85 MW, 396 ns Input E ach) 75 MW, 3168 ns 11.4 GHz R F S ource Induction Modulator

Klystron R F Pulse

2 Mode Launcher

slide-8
SLIDE 8
slide-9
SLIDE 9

DAC DAC

Re Im

K lystron (9.7 MW)

V ector Modulator ster llator Hz

Power Transmission Line

Cavity 12

......

Cavity 1

Cryomodule 1 of 3

Coaxial Coupler (Qext) Phase Tuner Beamline Mechanical and Piezo-E lectric Tuner (Df) Circulator

Length = 50 m, Filling Fraction with Quads = 75%

...... Future: 2 × 9 S uperstructure ne Feed per Pair, 6 % S horter

slide-10
SLIDE 10
slide-11
SLIDE 11

Main Linac Drive Bunch Compression (x 32) and Distribution Accelerated Beam Drive Beam Accelerator r 937 MHz - 3.9 MV /m - 1.18 GeV

x 2 x 4 x 4

182 Modulators / K lystrons 50 MW - 92 µs

2 m

Drive-Beam Accelerated Beam

QUAD

230 MW, 30 GHz

Transfer Structure

  • Acc. Struct.
  • Acc. Struct.

QUAD Transfer Structure

  • Acc. Struct.
  • Acc. Struct.

...

300 MW AC Power .8% AC to Beam Efficiency

slide-12
SLIDE 12

Collector for Spent Beam RF Input Coupler RF Output Coupler Gun RF Cavity Samarium Cobalt Permanent Magnet Rings Spacer Pole Pieces Magnetic Field

1.7 m

120 120 Distance Along Axis (mm)

Beam Size (mm) and Field Profile (au)

240 360 480

F

  • c

u s e d b e a m

Axial Magnetic Field 2 kG RMS ( 5 kG for Solenoid Focusing)

Solenoid Focused Tubes: Have Ten, 50 MW Tubes for Testing, However Solenoid Power = 25 kW. Developing Periodic Permanent Magnet (PPM) Focused Tubes to Eliminate the Power Consuming Solenoid.

slide-13
SLIDE 13

XP1: After a Number of Fixes, Achieved Stable Performance over 70 MW at 3 µs, Limited by the Modulator.

SLAC 75 MW PPM Klystron Program

XP3: Next Generation Tube Designed for Manufacturability

  • Diode Version (No RF Cavities) Has Been Successfully Tested.
  • Testing of Klystron Just Starting.

Longer Term: Sheet Beam Version

  • Lower Cost.
  • Well-Suited for Gridded Gun, Which

Would Simplify the Modulator.

Current Voltage

slide-14
SLIDE 14

Design PPM-2: Achieved Peak power 75 MW 75.1 MW at 505 kV Efficiency 55% 56% Pulse width 1.5 µs 1.4 µs at 73 MW 1.5 µs at 70 MW Repetition rate 150 Hz 25 Hz

  • KEK is working with Toshiba to develop PPM tubes as well -

the JLC RF system design requires only 1.5 µs long klystron pulses.

  • Currently testing a 75 MW tube (PPM-2), which basically

meets design goals, but full power testing is limited by the modulator.

  • Will build two new tubes during the next year with goals of

higher efficiency (60%) and easier manufacturability.

  • Also working on a 150 MW multi-beam klystron.
slide-15
SLIDE 15

Development

Photo of TH1801 Tube (top) and Cathode (bottom)

2.5 m

Reduce HV Requirements and Improve Efficiency (Lower Space Charge) with Multiple Beam Klystron Use Seven 18.6 A, 110 kV Beams to Produce 10 MW with a 70% Efficiency

Thales TH1801 MultiBeam Klystron Spec's: 10 MW, 10 Hz, 1.5 ms with 4 kW Solenoid Power First Tube Achieved 65% Efficiency at 1.5 ms, 5 Hz and Was Used in TTF

slide-16
SLIDE 16

UR CE S INDUCTIVE LY

Insulated Gate Bipolar Transistors

CTION CIR CUIT (1 OF N)

+

IGBT S upply Power Storage Capacitor MetGlas Core

10 cm Driver Circuit

C a p a c i t

  • r

s MetGlas Cores

/ LLNL / Bechtel NV

slide-17
SLIDE 17

15' 2" 8' 6" 24" 22" 38" 8" 4' 2" 4' 5" 30" 4' 4" 50" 21" 6' 5"

76 Cores 75 MW PPM Klystron

NLC Eight Klystron Induction Modulator

(1 GW Pulsed Power)

Drive 8 Klystrons with a 500 kV, 2 kA, 3 µs Pulse Generated from 76, 2.2 kV Induction Cores Summed Through a 3-Turn Secondary.

slide-18
SLIDE 18

Three Turn Seconday 76 Cores 5045 S-Band Klystron Used for Testing Water Load

slide-19
SLIDE 19

Bouncer Circuit 1 ms/div 500 V/div

V S E CONDAR Y V CAP BANK V BOUNCE R

11 kV (IGBT's)

a Capacitor Bank

115 kV, 130 A 1.7 ms 2 kV/div (top) 20 kV/div (bottom) 0.5 ms/div

(Zero Offset)

(1 kV Initally)

slide-20
SLIDE 20
  • To minimize cost, want unloaded gradient (GU) in the X-band linacs

to be 70 +/− 15 MV/m.

  • Both the 500 GeV and 1 TeV NLC designs assume a 70 MV/m

unloaded linac gradient.

  • For energy expandability, assuming lower cost X-band power sources

are available in the future, want structures to be able to operate at even higher gradients.

  • Gradient potential: have achieved > 100 MV/m at X-band in

standing-wave and short (0.3 m), low group velocity (< 3% c) traveling-wave structures in the past.

NLC Linac Gradient Considerations

slide-21
SLIDE 21

RF Input RF Output 10 µm

Pitting on Cell Irises of a 1.8 m Structure After Operation at Gradients up to 50 MV/m

SEM Iris Photograph

1.8 m X-Band Structure

3% c 12% c

Group Velocity

slide-22
SLIDE 22
  • Compare performance versus different:

– Initial structure group velocity (5 % and 3% c) and length (20, 53 and 105 cm) – Cell machining (single and poly diamond) and cleaning (etch time) methods – Structure type: standing-wave -vs- traveling-wave. Thus far have processed 12 structures (> 5000 hours operation at 60 Hz).

  • Systematic study of rf breakdown

– Measure RF, light, sound, X-rays, currents and gas associated with rf breakdown in structures, waveguides and single cavities. – Simulate breakdown effect on RF transport with ‘MAGIC’ particle-in-cell code. – Measure surface roughness/cleanliness/damage with SEM, EDX, XPS and AES.

  • Improve structure handling and cleaning methods

– Adopted better degassing procedure that includes:

  • Wet and dry H2 firing
  • 650 °C vacuum bake for 16 days
  • 225 °C in-situ bake for 7 days.

Program to Improve High Gradient Performance

slide-23
SLIDE 23

Low Group Velocity Traveling-Wave Structures

  • Best performance thus far with 3% c initial group

velocity structures.

  • One was processed to 86 MV/m, after which

breakdown rate at 70 MV/m was about 1 in 200,000 pulses, dominated by input/output coupler events. Rate at 65 MV/m was about 10 times smaller, which would be acceptable for the NLC.

  • Damage level small during processing (1/2° phase

shift) – tolerable for NLC even if increased at same rate after processing, which has not been observed.

  • Tests of 3% c and 5% c initial group velocity

structures with improved couplers, NLC-acceptable iris radii and wakefield detuning are scheduled this year – versions with wakefield damping will be ready in early 2003.

T53VG3: 53 cm long, 60 cells

slide-24
SLIDE 24
  • In NLC, standing-wave structures

would operate at the loaded gradient of 55 MV/m.

  • In recent tests, breakdown rates of

< 1 per 8 million pulses were measured at this gradient and the structures showed no discernable damage (∆f/f < 10-5) after processing, making this design a canidate for the NLC.

  • Next round of structures will have

lower surface fields and wakefield detuning – incorporating wakefield damping will take 1-2 years.

Standing-Wave Structures

(15 Cells, 20 cm Long, 124 ns Field Rise Time)

slide-25
SLIDE 25

Cavity Development

Goals during past decade: increase cavity gradients from 5 to 25 MV/m and reduce cavity costs by a comparable factor. Built on experience from industrial fabrication of cavities for CEBAF. Improved material QC and introduced new cavity preparation procedures, including 1400 °C annealing with a titanium getter, ultra-pure, high pressure water rinsing and high-power processing. Have achieved gradient goal and now working to increase operating level to 35 MV/m to allow a future TESLA upgrade to 800 GeV cms.

slide-26
SLIDE 26

E mitter

Field E mission in a S uperconducting R F Cavity

Map of Temperature Increase Caused by Field E mission

100 200 300 20 5 10 15 350 50 100 150 200 250 300 Thermometer

Angle (degrees)

400 500 DT (mK )

*

E mitter location

Sensor Number along Longitude

  • J. Knobloch
slide-27
SLIDE 27

Excitation Curves Measured in the Vertical Cryostat for Cavities from the Third Production Series

Average Cavity Gradients at Qo ≥ 1010 Measured in the Vertical Cryostat for (a) the First Three Production Series and (b) Cavities Installed in the First Five Eight-Cavity Cryomodules

5 10 15 20 25 30 35 109 1010 1011

Goal Goal

Eacc (MV/m) Qo

Red = Module Performance in TTF

High Gradient Performance

Goal Goal

slide-28
SLIDE 28

Eacc (MV/m)

5 10 15 20 25 30 35 40 45

10 09 11

EP Single Cells

Eacc (MV/m) Qo After BCP After EP

5 10 15 20 25 30 35 1010 109 1011

9 Cell Cavity

Results Using Electro-Polishing (EP) Technique Developed at KEK in which Material is Removed in an H2SO4, HF Mixture Under Current Flow

  • vs-

Buffered Chemical Polishing (BCP)

0.5 mm 0.5 mm

slide-29
SLIDE 29

ross-sectional View of the Tapered-Damped Structure (TDS) Geometry. Photograph of a TDS Cell with Damping Waveguides and SiC loads.

Silicon Carbide Load amping aveguide

Developing wakefield damping and detuning methods at 30 GHz. High gradient studies: Limited by power source: only 16 ns pulses available (130 ns needed). Seeing breakdown limits at 60-70 MV/m in test structures.

slide-30
SLIDE 30

R elative Phase Control R F Amplitude Control 2 kW TWT Accelerator S tructures Klystrons (50 MW, 1.5 µs Pulses) S LE D II Pulse Compression Beam 11.424 GHz R F R eference Arbitrary Function Generator 3 dB Hybrid 40 m R esonant Delay Lines × 4

  • nstruction Started in 1993 Using First

eneration RF Component Designs.

  • als: RF System Integration Test of a Section of

LC Linac and the Efficient, Stable and Uniform cceleration of a NLC-like Bunch Train. 1997, Demonstrated 15% Beam Loading

  • mpensation of a 120 ns Bunch Train to < 0.3%.

NLCTA Linac RF Unit (One of Two) NLCTA Linac

slide-31
SLIDE 31

75 MW PPM Klystrons

2 x 75MW 600MW 396 ns

TE 02 TE 01 TE 01 TE 02

Cross Potent Hybrid

TE 11 TE 01

Load Trees

TE 01 150MW 3.168 µs 3.168 µs

S LE D II Alternative for NLC DLDS Component Testbed

E ight-Pack Test Phase I: Multi-Moded S LE D II

(Begin Testing at E nd of 2002)

slide-32
SLIDE 32

Test of E ssential NLC R F S ystem Components

(Full-S cale Testing Begins in Mid-2004)

Level R F S ystem kV, 3-Turn Induction Modulator t 2 KW TWT Klystron Drivers (not shown) t 75 MW PPM Klystrons uced Delay Line Distribution S ystem (2 Mode) Accelerator S tructure S extets (11 m Total)

S ingle Mode E xtractor Beam 117.2 m of Circular Waveguide Two S et of S ix 0.9 m Accelerator S tructures (85 MW, 396 ns Input E ach) 75 MW, 3168 ns 11.4 GHz R F S ource Induction Modulator

Klystron R F Pulse

2 Mode Launcher

up Includes:

slide-33
SLIDE 33

Eight Cavity Cryomodules

The TESLA Test Facility (TTF) TTF Linac

slide-34
SLIDE 34

TESLA Test Facility Phase II: FEL User Facility in the nm Wavelength Range

  • 1 GeV Beam Energy Achieved Using 6 Cryomodules with 8 Cavities Each,

About 50 m of Accelerator.

  • One Cryomodule Will Contain 8 Electro-Polished Cavities.
  • Provides Testbed for Klystrons and Modulators Developed with Industry.
  • High Gradient Test Program to Start in Summer of 2003.
slide-35
SLIDE 35
  • NLC: 1 TeV CMS

– Fill second half of each tunnel with RF components (linac tunnel length remains the same). – Run with same linac beam parameters as 500 GeV operation. Linac AC power doubles.

  • TESLA: 800 GeV CMS

– Run at 35 MV/m with 50% higher beam power (linac tunnel length remains the same). – Requires doubling 2 K cooling capacity and number of klystrons and

  • modulators. Linac AC power increases by 50%.
  • CLIC

– Lengthen linac and drive beam. – Drive accelerator requires proportionally higher modulator capacity, cooling and AC power.

Energy Upgrades

slide-36
SLIDE 36
  • A 500 GeV cms collider could be built with either X-Band (NLC/JLC) or

Superconducting (TESLA) technologies that have been demonstrated

  • ver the past 4-5 years.

– TESLA cryomodules at 23 MV/m gradient. – X-Band NLCTA power source with low group velocity traveling- wave structures or standing-wave structures.

  • TESLA and NLC/JLC will both be testing in the next 2-3 years

improvements needed to secure 800-1000 GeV cms energies. – TESLA cryomodules at 35 MV/m gradient. – X-Band 8-Pack power source and delay-line rf distribution.

  • CLIC needs to develop a longer pulse power source for high gradient
  • testing. The CTF3 two-beam facility will be ready in 2005.
  • Detailed comparison of linear collider designs will be published this

Summer (Loew Report).