barrett s esophagus be
play

Barretts esophagus (BE) Dysplasia in Barretts Esophagus Distal - PowerPoint PPT Presentation

5/26/2018 Barretts esophagus (BE) Dysplasia in Barretts Esophagus Distal esophagus and Inflammatory Bowel Disease: Diagnosis, Biomarkers, and Management Proximal part of stomach Won-Tak Choi, MD, PhD Assistant Professor Department


  1. 5/26/2018 
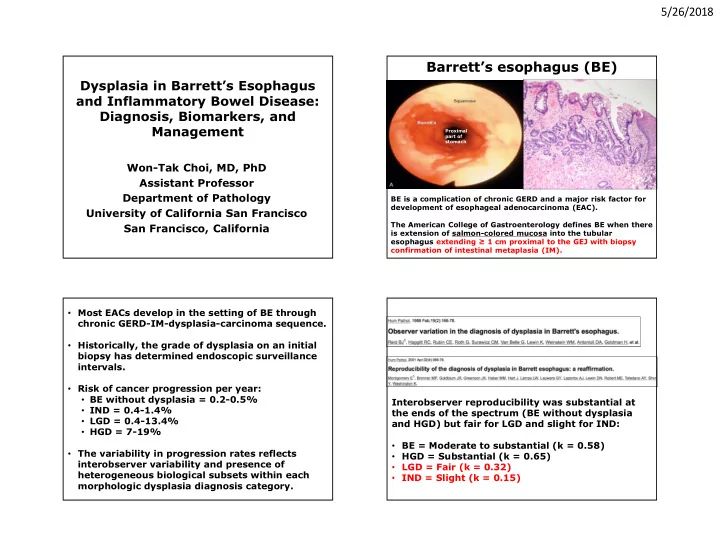
Barrett’s esophagus (BE) Dysplasia in Barrett’s Esophagus Distal esophagus and Inflammatory Bowel Disease: Diagnosis, Biomarkers, and Management Proximal part of stomach Won-Tak Choi, MD, PhD Assistant Professor Department of Pathology BE is a complication of chronic GERD and a major risk factor for development of esophageal adenocarcinoma (EAC). University of California San Francisco The American College of Gastroenterology defines BE when there San Francisco, California is extension of salmon-colored mucosa into the tubular esophagus extending ≥ 1 cm proximal to the GEJ with biopsy confirmation of intestinal metaplasia (IM). • Most EACs develop in the setting of BE through chronic GERD-IM-dysplasia-carcinoma sequence. • Historically, the grade of dysplasia on an initial biopsy has determined endoscopic surveillance intervals. • Risk of cancer progression per year: • BE without dysplasia = 0.2-0.5% Interobserver reproducibility was substantial at • IND = 0.4-1.4% the ends of the spectrum (BE without dysplasia • LGD = 0.4-13.4% and HGD) but fair for LGD and slight for IND: • HGD = 7-19% • BE = Moderate to substantial (k = 0.58) • The variability in progression rates reflects • HGD = Substantial (k = 0.65) interobserver variability and presence of • LGD = Fair (k = 0.32) heterogeneous biological subsets within each • IND = Slight (k = 0.15) morphologic dysplasia diagnosis category. 1

  2. 5/26/2018 • Biopsies from 485 patients carrying a local institutional diagnosis of HGD were reviewed by Following histological review by two expert GI three GI pathologists. pathologists, 73-85% of LGD cases diagnosed in the community were downgraded to non- • Only 51% were confirmed to have HGD. dysplastic BE or IND. • GI pathologists achieved a high-level agreement For confirmed LGD, the risk of HGD/EAC was 9- (K = 0.77) for HGD. 13% per patient-year, whereas patients downgraded to non-dysplastic BE or IND had a progression risk of 0.5-0.9%. Among 1203 consecutive consultative cases • collected at 6 academic centers during 2016-17, Due to significant interobserver variability upper GI cases accounted for 29%. in the interpretation of dysplasia, review by two pathologists, at least one of whom has Esophagus was the most common site (56%), • specialized expertise in GI pathology, is comprised mostly of BE-related consults (84%). warranted for dysplasia of any grade. Discordance with submitted diagnosis was 40%, • and downgrading of dysplasia was more common (67%). Lam-Himlin D. et al. Mod Path. 2018. Mar;31(suppl. 2): 278. 2

  3. 5/26/2018 Challenges in interpreting Are Ancillary Studies Needed for Dysplasia p53 stain: Diagnosis or Risk Stratification in BE Patients? (A, B) Two nondysplastic The interpretation of staining results (such as p53 • examples of BE showing and AMACR) is highly variable and subjective. scattered intensely staining nuclei. Non-neoplastic epithelium (~10-15%) frequently • shows positive staining (often strong and diffuse), especially when mucosa is inflamed or ulcerated. The diagnostic utility of genetic and chromosomal • abnormalities (including 9p loss of heterozygosity (LOH), 17p LOH, and mutations of p53 and cyclin- dependent kinase N2 (tumor suppressor genes)) is (C) Diffuse and intense also limited, as these changes tend to occur early staining. and frequently in BE even without dysplasia. Srivastava A. et al. AJSP. 2017. 41(5): e8-e21 Srivastava A. et al AJSP. 2017. 41(5): e8-e21 HGD with strong and diffuse p53 staining (overexpression) correlating with TP53 mutations This biopsy sample obtained from an area adjacent to an ulcer shows mild nuclear enlargement with mucin depletion and infiltration by neutrophils that, at most, may be considered IND. However, the cells show strong, diffuse p53 staining. HGD with complete absence of p53 staining (null pattern, 20% of the time) also correlating with TP53 mutations Panarelli NC. et al. AJSP. 2016. 40(8): e83-e93 3

  4. 5/26/2018 Scoring p53 IHC is subject to interobserver variability Srivastava A. et al. AJSP. 2017. 41(5): e8-e21 27% 14% 10% 3% A diagnosis of dysplasia remains a morphologic diagnosis. 53% 46% 64% 57% Existing data are insufficient to recommend ancillary stains as a prognostic marker. 4

  5. 5/26/2018 Outdated assumptions regarding DNA flow cytometry • Not widely available to pathologists and clinicians, because it typically needs fresh tissue which requires special handling procedures and does not allow direct histology-flow cytometry “DNA content abnormalities (using DNA flow correlation. cytometry)…defined patients at increased risk for progression to cancer…at the present time, no • Requires considerable technical and professional biomarkers or panels of biomarkers are ready for expertise. clinical practice.” The majority of HGD cases (95%) showed aneuploid population(s) (red and blue) that are visually distinguishable from the normal All BE cases without dysplasia showed diploid population (green) normal DNA content (no aneuploidy) Diploid (2N) Tetraploid (4N) < 6% 5

  6. 5/26/2018 A subset of LGD cases (21%) showed a distinct aneuploid population (red) 14% within 1 year 31% within 5 years HR = 7 85% within 1 year (p < 0.001) 100% within 5 years (p < 0.001) A subset of IND cases (10%) showed 6% within 13 years a distinct aneuploid population (red) HR = 20 100% within 2 years (p < 0.001) 6

  7. 5/26/2018 After endoscopic eradication therapy, the baseline degree of dysplasia determines appropriate endoscopic surveillance intervals Endoscopically visible nodularity Endoscopic mucosal resection (in 3-6 months) For LGD, continued surveillance every 12 months is an acceptable approach. Shafa S. et al. AJG. 2017. 112(10): 1487-1490 Inflammatory Bowel Disease Dysplasia is the best marker of colorectal • cancer (CRC) risk in IBD patients, and surveillance colonoscopy is recommended to detect dysplasia or early CRC. Most dysplasia (~90%) is visible with newer • endoscopic technologies. • Endoscopically resectable polypoid dysplasia (even for HGD) has a good prognosis (thus no Targeted biopsies detect similar proportions of • colectomy required). dysplasia as random biopsies. • Some other recent guidelines have suggested Such a paradigm shift may have important • colectomy for nonpolypoid dysplastic lesions implications for the surveillance and (including flat and ‘invisible’ lesions), because management of dysplasia. they are usually not endoscopically resectable. 7

  8. 5/26/2018 Synchronous CRC: Flat HGD = up to 67% Flat LGD = up to 27% (including “invisible”) (including “invisible”) Progression rate: Flat HGD = 25-32% Flat LGD = 0-53% • Negative = fair to good (k = 0.4-0.5) • HGD = fair to good (k = 0.4-0.5) • LGD = poor (k = 0.2-0.3) • IND = poor (k = 0.01-0.2) GI pathologist should review all • Overall = poor to fair (k = 0.3-0.4) biopsy specimens diagnosed initially as IND, LGD, or HGD. Are Ancillary Stains Needed for Dysplasia Diagnosis or Risk Stratification in IBD Patients? • The interpretation of staining results (such as p53) is highly variable and subjective (depending on the location, intensity, extent, and/or number of positive cells; often using Strong nuclear p53 staining Weak nuclear p53 staining Strong cytoplasmic staining different cutoff values for positive • Correlated p53 expression of 44 IND cases with outcomes. immunoreactivity). p53 expression was determined as a percentage of epithelial cells • within a HPF showing strong nuclear, weak nuclear, or strong • Strong and diffuse staining (up to 10%) can be cytoplasmic staining. seen in non-neoplastic mucosa, especially in Composite p53 score = sum of (i) the percentage of epithelial cells areas of active inflammation (up to 100%). • with weak nuclear staining, (ii) three times the percentage of epithelial cells with strong nuclear staining, and (iii) the percentage of epithelial cells with strong cytoplasmic staining. 8

  9. 5/26/2018 (Basal 1/3) (Middle 1/3) (Top 1/3) (9%) (92%) X “Aneuploidy has been the most thoroughly investigated...However, evaluation of aneuploidy by flow cytometry requires considerable technical and professional (43%) expertise, which limits its use in routine practice.” (100%) Strong p53 staining? (57%) Strong intensity p53 staining suggests dysplasia, and restriction of p53 staining to the basal 2/3 of the crypt appears to exclude HGD. 9

  10. 5/26/2018 A significant number of flat LGD cases (41%) showed a distinct aneuploid Almost all flat HGD cases (93%) population (red) showed a distinct aneuploid population (red) 5% within 1 year 33% within 12 years The majority of IND cases (64%) showed normal DNA content HR = 5 57% within 1 year (p < 0.001) 100% within 12 years (p = 0.001) Wen KW and Choi WT. Under Review. 10

  11. 5/26/2018 5% within 7 years HR = 13 A subset of IND cases (37%) showed a distinct aneuploid population (red) 12% within 1 year (p = 0.136) 34% within 3 years (p = 0.029) 59% within 7 years (p = < 0.001) Conclusions • A diagnosis of dysplasia in BE and IBD remains a morphologic diagnosis at this time. • Ancillary stains (such as p53) are not currently recommended as a diagnostic or prognostic marker. • DNA flow cytometry is a promising tool that can provide supportive evidence to a morphologic impression or suspicion of HGD and risk stratify LGD or IND. 11

  12. 5/26/2018 Thank you! won-tak.choi@ucsf.edu 12

Recommend


More recommend