
SLIDE 1
10/5/2018 1
2018, Jay Cochran, III PhD
- Banker has to Manage Credit Risk, Interest Rate Risk, and
Liquidity, and still earn a profit
- A Business in a set of Financial Statements
– Balance Sheet
- “Snapshot” of a moment in time
- What the firm owns (assets), and to whom it owes money
- Assets = Liabilities + Owners’ Equity (Capital)
– IMPORTANT: Capital = Assets – Liabilities
– Income Statement
- “Movie” of money flowing through a firm over time
- Revenue – Expenses = Op’g Income – Taxes = Net Income
- The 2 are connected by Capital (OE) & Net Income
– Net Income (Loss) not paid out in dividends is Retained
- Firms can pay dividends even if not profitable.
2018, Jay Cochran, III PhD
- Determine your Bank’s FDIC Certificate No.
- Using the FDIC’s “Statistics on Depository Institutions
(SDI)” Database and your Bank’s FDIC Certificate No., pull the following reports:
– Balance Sheet – Income Statement
- Including detail of loan and deposit interest
- Example reports tie to SDI Report Line no.s
– If missing Line no. = calculation – Analytical “Cookbook”
2018, Jay Cochran, III PhD
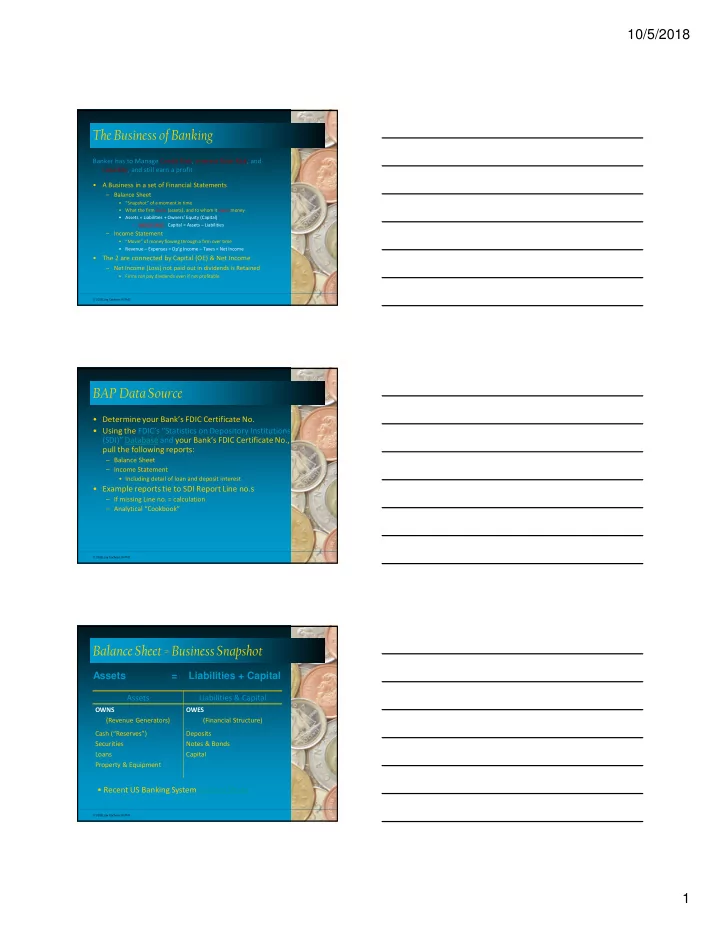
- Assets
Liabilities & Capital
OWNS (Revenue Generators) OWES (Financial Structure) Cash (“Reserves”) Securities Loans Property & Equipment Deposits Notes & Bonds Capital
Assets = Liabilities + Capital
- Recent US Banking System Balance Sheet