Automated Time-domain Astrophysics is entering its golden age with a - - PowerPoint PPT Presentation

automated
SMART_READER_LITE
LIVE PREVIEW

Automated Time-domain Astrophysics is entering its golden age with a - - PowerPoint PPT Presentation

Automated Time-domain Astrophysics is entering its golden age with a number of new telescopes coming online, generating large volume of high Spectro- cadence quality data. Rapid follow-up of the transient astronomical events discovered by them


slide-1
SLIDE 1

Automated Spectro- Photometric Image REDuction

Marco C Lam+ Robert J Smith Iain A Steele

Liverpool Telescope, ARI, Liverpool JM University, UK

+C.Y.Lam@LJMU.ac.uk

Time-domain Astrophysics is entering its golden age with a number of new telescopes coming online, generating large volume of high cadence quality data. Rapid follow-up of the transient astronomical events discovered by them are essential to enable science.

Introduction

IRAF[2] has been the "industrial standard" in astronomical data reduction since the 1980s, from undergraduate class to data reduction for the state-of-the-art observatory facilities at a volume rate of hundreds of GB per night. The deprecation of its support by Space Telescope Science Institute and the incompatibility with the 64-bit system will slowly paralyse the data reduction process. A replacement is essential in the future of all branches of Observational Astronomy.

Funding Body OPTICON WP13 (EC Horizon 2020)

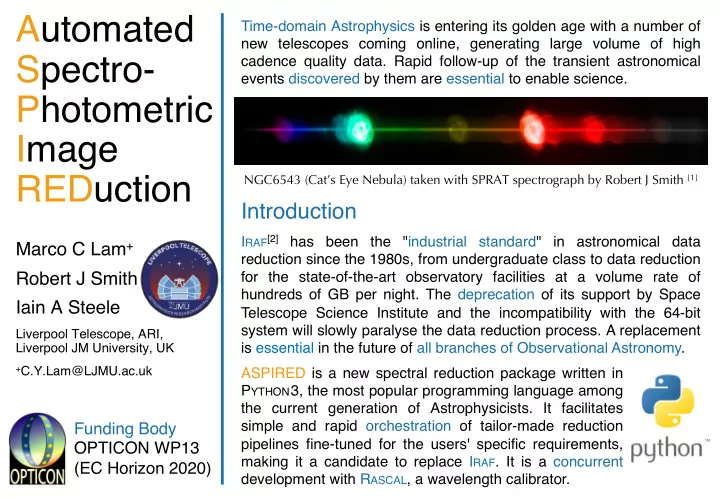
NGC6543 (Cat’s Eye Nebula) taken with SPRAT spectrograph by Robert J Smith [1]

ASPIRED is a new spectral reduction package written in PYTHON3, the most popular programming language among the current generation of Astrophysicists. It facilitates simple and rapid orchestration of tailor-made reduction pipelines fine-tuned for the users' specific requirements, making it a candidate to replace IRAF. It is a concurrent development with RASCAL, a wavelength calibrator.

slide-2
SLIDE 2

Dispersion Element (e.g. prism, grating) Light Source (e.g. Sun) Long Wavelength (red) Short Wavelength (blue) Detector Camera An electromagnetic spectrum is the entire range

  • f

wavelengths of electromagnetic radiation. Each source has its characteristic emission or absorption features. Spectrographs are used to disperse the incident light into a spectrum and record the data with a detector (e.g. CCD). The “rainbow spectrum” is the visible range that can be seen by the naked eye, from 390 to 700 nm.

Spectrum and Spectrograph

Different responses recorded by the camera of the same source (ASASSN14gh) using red and blue optimised dispersion gratings

  • n the SPRAT spectrograph[3] on the Liverpool Telescope.

The spectra below show four strong and broad absorption features. The physical processes behind them always produce them at those specific wavelengths in the source. Measuring the strength, shape, shift and broadening of the features allows us to derive the intrinsic properties of the source that created and modified the appearance of the spectrum as observed on Earth. Cartoon of the basic design

  • f a spectrograph

Doing Science with a Spectrum

Si II S II Fe II Mg II Infrared UV

slide-3
SLIDE 3

Data Processing and Extraction

Spectral data extraction follows 4 steps:

▲ 1. 2D image of a spectrum from LT/SPRAT. The vertical lines show the emission spectrum of our atmosphere. The horizontal line is the astronomical spectrum dispersed by the grism. The dashed line show the trace of the spectrum.

Dispersion Direction (wavelength direction) Spatial Direction

1 :: Image Flattening This step corrects for the varying optical and detector behaviour across the image. The processed image reproduce the signal that a uniform detector should produce. 3 :: Wavelength Calibration The dispersion-to-wavelength relation has to be applied to the spectrum before it can enable science. It works by comparing against the spectrum from an arc lamp with the known position-to-wavelength relation. 4 :: Flux Calibration Detector sensitivity varies as a function of wavelength, so the signal requires a scaling. This is done by applying the sensitivity of the instrument computed from a standard star with well-known flux. 2 :: Spectral Tracing & Extraction The spatial positions of the 2D spectrum are identified along the dispersion direction. The signals are then summed to give the response as a function of the dispersion.

◀ 2. The extracted spectrum (blue) and the quality of the spectral signal (grey). The sky emissions are subtracted in the extraction process to give the spectrum of the target only. ▲ 3. A spectrum of a Xenon arc lamp from LT/SPRAT. The arc lines are at well known wavelength such that we can compute a function to describe the position-to-wavelength relation.

Wavelength / Angstrom

◀ 4. The wavelength and flux calibrated spectrum (blue) of a typical M dwarf star showing many absorption features due to its atmosphere. This can be compared against models for further scientific investigation.

slide-4
SLIDE 4

Software Stack

The ASPIRED uses a number of popular and well-maintained packages including ASTROPY[4], NUMPY[5], SCIPY[6], RASCAL[7], SPECTRES[8], and their associated dependencies. They allow simple maintenance and housekeeping. Software Versioning, Continuous Integration and Automated Documentation are enabled with GitHub, Travis CI and Readthedocs (Rtd). With every new commit is made to GitHub, Travis CI will be triggered automatically to test the compilation as well as any other test cases provided, while Rtd generates new documents to update the differences made in the most recent commit. The installation guide and user menu including examples are available at the Rtd link (see below). ASPIRED is still undergoing development, but three data pipelines are already building on top of it: an upgrade of the LT/SPRAT pipeline, a new instrument SAAO/Mookodi[9], and an observation broker BlackholeTOM[10] at the University

  • f
  • Warsaw. The continuous development will carry on

for at least 2 more years, funded by the Tel-Aviv University from October 2020.

Usage

GitHub: https://github.com/cylammarco/ASPIRED Readthedocs: https://aspired.readthedocs.io/en/latest/ arXiv: https://arxiv.org/abs/1912.05885

[1] http://telescope.livjm.ac.uk/News/Archive/index.php?sf=s20160924 [2] Tody D., 1986, SPIE, 627, 733 [3] Piascik, A. S, et al. in Proc. SPIE, vol. 9147 of Society of Photo- Optical Instrumentation Engineers (SPIE) Conference Series, 91478H [4] Astropy Collaboration, et al. 2018, AJ, 156, 123.1801.02634 [5] Walt, S. v. d, et al. 2011, Computing in Science and Engg., 13, 22 [6] Virtanen, P., et al. 2019, arXiv e-prints, arXiv:1907.10121 [7] Veitch-Michaelis J., Lam M. C., 2019, arXiv, arXiv:1912.05883 [8] Carnall, A. C. 2017, arXiv e-prints, arXiv:1705.05165 [9] https://topswiki.saao.ac.za/ [10] http://visata.astrouw.edu.pl:8080/bhlist/

Reference