
SLIDE 1
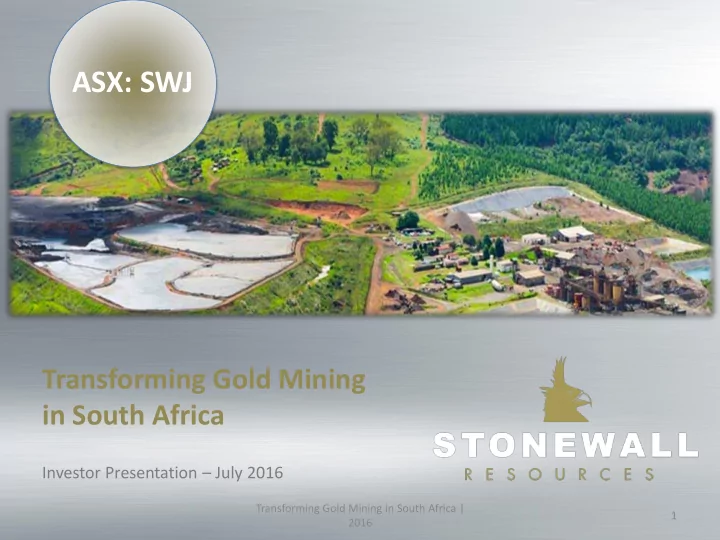
ASX: SWJ
Transforming Gold Mining in South Africa
Investor Presentation – July 2016
Transforming Gold Mining in South Africa | 2016 1
ASX: SWJ Transforming Gold Mining in South Africa Investor - - PowerPoint PPT Presentation
ASX: SWJ Transforming Gold Mining in South Africa Investor Presentation July 2016 Transforming Gold Mining in South Africa | 1 2016 Disclaimer This Presentation has been prepared by and issued by Stonewall Mining Limited (ASX.SWJ)
Transforming Gold Mining in South Africa | 2016 1
parties about the Company and should not be considered as an offer or invitation to subscribe for or purchase any securities in the Company or as an inducement to make an offer or invitation with respect to those securities. No agreement to subscribe for securities in the Company will be entered into
investors for the purposes of s708(11) of the Corporations Act 2001 or persons who hold Australian financial services licences and any of their
forward looking statements. Whilst Stonewall has no reason to believe that any such statements, forward looking statements and projections are either false, misleading or incorrect, it cannot and does not warrant or guarantee that through either the passage of time or actions beyond the control
contained in this presentation constitutes investment, legal, tax or other advice. This overview of Stonewall does not purport to be all inclusive or to contain all information which its recipients may require in order to make an informed assessment of the Company’s prospects. Before making an investment decision, you should conduct, with the assistance of your broker or other financial or professional adviser, your own investigation in light of your particular investment needs, objectives and financial circumstances and perform your own analysis in order to satisfy yourself as to the accuracy and completeness of the information, statements and opinions contained in this presentation prior to making any investment decision. You must make yourself fully aware and all risks associated with this offering and that you do not rely upon warranties or representations by Stonewall and/or its
warranty, express or implied, as to, and take no responsibility and assume no liability for, the authenticity, validity, accuracy, suitability or completeness of, or any errors in or omissions, from any information, statement or opinion contained in this presentation. The contents of this presentation are confidential. This presentation is being provided to you on the condition that you do not reproduce or communicate it or disclose it to,
which are proprietary to Stonewall. By agreeing to receive this information you also agree to respect the confidential nature of this entire presentation. Specifically you agree not to reproduce in any manner or distribute any part of the information contained herein without the prior written consent of the Company.
van Heerden, who is currently employed as a Director and as Principal Mining Engineer by Minxcon Projects (Pty) Ltd. His qualifications include a B.Eng. (Mining) from the University of Pretoria in 1985 and a M.Com.(Business Administration) from Rand Afrikaans University (now UJ) in 1993. He is a member in good standing of the Engineering Council of South Africa and is registered as a Professional Engineer with registration no. 20050318 as well as a Fellow in good standing of the South African Institute of Mining and Metallurgy with Membership No. 37309 which is a Recognised Overseas Professional Organisation’ (ROPO) included in a list promulgated by the ASX from time to time. He has worked as a Mining Engineer for more than 28 years with more than 15 years directly associated with gold mining specifically..Daniel van Heerden is employed by Minxcon and has sufficient experience which is relevant to the style of mineralization and type of deposit under consideration and to the activity which he is undertaking to qualify as a Competent Person as defined in the 2004 Edition of the ‘Australasian Code for Reporting of Exploration Results, Mineral Resources and Ore Reserves’. Daniel van Heerden consents to the inclusion in this Presentation of the matters based on his information in the form and context in which it appears.
Transforming Gold Mining in South Africa | 2016
2
LONG TERM DEBTS Beatle Rock A$ 0.45m 8/16 BMIL Loan A$ 0.25m 9/16 Tasman Convertible (fixed $0.009) A$ 1.65m 6/17 APCIG A$ 4.75m 10/16 KEY MANAGEMENT & DIRECTORS George Jenkins CEO and Director of SWM – Metallurgist (Australian/South African) Trevor Fourie Director/Acting Chairman – (Australian) Stephen Gemell Director – Mining Engineer (Australian) Bill Richie Yang, Director (Australian) COMPANY SECRETARY Peter Hunt Transforming Gold Mining in South Africa | 2016 ASX code: SWJ Current share price: AUD $0.013 Market Capitalisation: AUD $23.5 million (Source: ASX website) Mineral Resources: 2.99Moz Free floating shares: 1.81 billion MAJOR SHAREHOLDERS Tasman Funds Management Pty Ltd High Gift Investments Ltd Best Wealth Winner Ltd Smart Vision Investment Group Ltd Khan International Ltd 3
Transforming Gold Mining in South Africa | 2016
processing facilities.
Mineral Resource of 2.99Moz (see page 39 “Resource Table”)
Operation
2.4Moz (PMR) (see tables on page 40 & 41)
Description Value
All in Sustainable Cost per Tonne (Over Stage One) US$57/t All in Sustainable Cost per Tonne 2017 US$42/t Initial CapEx (20% Contingency) US$15.1m Stage One LOM 10 Years 4
* This is a strategic target only, not a forecast or projection. Refer forward looking statement on page 2.
TGME – Pilgrim’s Rest / Sabie Mines: Large fully permitted South African Acreage 62000 Ha. (75km North to South and 25km East to West)
Transforming Gold Mining in South Africa | 2016 5
Transforming Gold Mining in South Africa | 2016 6
Northern Central Southern
TGME CIL Au Plant
– Resources, PMR targets
– Resources, PMR targets – CIL Gold Plant, – Full elution circuit, – Existing tailing dams on-site
– Resources, PMR targets, – Existing tailings
7 Transforming Gold Mining in South Africa | 2016
Transforming Gold Mining in South Africa | 2016 8
Transforming Gold Mining in South Africa | 2016
some 300kms from the Witwatersrand (WITS) which, at the time, had no identity.
the first gold coins (The Burger’s sovereign).
gold for over 100 years.
Rebellion and First and Second World Wars)
deep mining technologies
costs of acid mine drainage water and high cost on mining
9
Area also produced significant volumes of copper, silver, superphosphates (fertilizers) and pyrites (for sulphuric acid production)
Transforming Gold Mining in South Africa | 2016 10
11 Transforming Gold Mining in South Africa | 2016
Transforming Gold Mining in South Africa | 2016
12
Transforming Gold Mining in South Africa | 2016
13
Transforming Gold Mining in South Africa | 2016
1895
into underground mining of oxidized reef and then fresh un-oxidized reef
Sabie is a subsidiary of Stonewall along with TGME
g/t
from 1-50 g/t
1125 cmg/t)
Limited, Randgold & Exploration Ltd and Simmer & Jack Mines Ltd.
14
should have been larger than what they actually were. Question asked where this material had gone to
project was born
into production
broader view on PMR mines available for production implemented
Transforming Gold Mining in South Africa | 2016 15
Transforming Gold Mining in South Africa | 2016 16
phase mining approach
Transforming Gold Mining in South Africa | 2016
and is now ready to mine for gold ore Phase 1 Drill and Blast Ore : The ore is drilled and blasted into void and is ready for high grading through hand sorting Phase 2 Hand Sorting : Hand sorting removes visible and large sized high grade material leaving a residue Lighting equipment used for hand sorting was primitive (candle and paraffin headlamps) resulting in an ineffective hand sorting process which also did not cater for effective fines removal. The fines carry the higher values and was left in the stopes
17
Transforming Gold Mining in South Africa | 2016
Phase 4 Drill and Blast Waste : The waste is drilled and blasted into the void and is now ready for packing against “Stonewalls” Phase 5 Clean Up : The waste is packed against “Stonewalls” and support is put in place for the next cycle of mining Phase 3 Residue Packing : The residue is packed against “Stonewalls”
18
Production for Central Division in proximity of existing Plant and infrustructure:
production by Q2 of 2017
Transforming Gold Mining in South Africa | 2016 Northern Central Southern
TGME CIL Au Plant Mine
2017 2018 2019 2020 2021 2022 2023 2024 2025 2026
Beta Dukes Browns Hill Dukes South Poniekranz Theta Clewer
19
* This is a strategic target only, not a forecast or
page 2.
Transforming Gold Mining in South Africa | 2016
19,500 tonnes per month per mine
using wet screening.
68 % of mass.
milled, thickened and processed through CIL plant.
smelted into bars for sale.
20
* This is a strategic target only, not a forecast or projection. Refer forward looking statement on page 2.
Transforming Gold Mining in South Africa | 2016
Description Value Average annual mining volume 445,000 t Initial Life of project 10 years Average Mined Grade Subject to PMR Resource Delineation Program in Q3 2016
21
* This is a strategic target only, not a forecast or projection. Refer forward looking statement on page 2.
Transforming Gold Mining in South Africa | 2016
Description Value Initial Capital (2016/2017) US$ 15.1 Million Sustaining Capex (2018 – 2026) US$ 6.1 Million Total LOM Project Capital Requirement US$ 21.2 Million
22
* This is a strategic target only, not a forecast or projection. Refer forward looking statement on page 2.
material)
– Capital cost is low however operational risk is high hence this technique not being proposed as the mining method commencement of the project; however – Hydraulic reclamation is expected to reduce capital and operating costs and require fewer personnel. The process will be reviewed after trial mining section is completed
Transforming Gold Mining in South Africa | 2016 23
* This is a strategic target only, not a forecast or projection. Refer forward looking statement on page 2.
volumes
the lower level employees within the workforce
performance bonuses
Transforming Gold Mining in South Africa | 2016
Staff Functional Area Salaries Wages Total Corporate 5
Finance and Administration 9
Safety 1
HR, Training and Health
3 6 9 Security 1
Stores 1 1 2 Technical Services
17 97 114 Maintenance 7 8 15 Pre-Conditioning and Plant 7 43 50 Total 51 155 206
24
* This is a strategic target only, not a forecast or projection. Refer forward looking statement on page 2.
Transforming Gold Mining in South Africa | 2016
Programme to be submitted to DMR for review currently Hard Rock Mining Proposed
currently Hard Rock Mining Proposed
processes
for redundancy
Description M1 M2 M3 M4 M5 M6 M7 M8 M9 M10 M11 M12 M13 Resource Delineation Drafting, Submission and Approval of Amended Mines Works Programme for Beta and Dukes Detailed Mine Design Beta and Dukes Detailed Engineering Design Mines and Plant Mine Equiping Plant Upgrade/Refurbishment Commissioning (Gold Sales Commence M10) Full Production
25
* This is a strategic target only, not a forecast or projection. Refer forward looking statement on page 2.
NOTE: The data below reflects the 2015 costs of the other producers and no escalations have been applied to these mines when considering the comparison Transforming Gold Mining in South Africa | 2016
26
* This is a strategic target only, not a forecast or projection. Refer forward looking statement on page 2.
Transforming Gold Mining in South Africa | 2016 27
Transforming Gold Mining in South Africa | 2016
– Bring PMR into production
– Bring Blyde Tailings dam into production – New Processing Plant Required, no crushing or milling
– Bring 5 hard rock mines into production at 10 ktpm per mine – New Processing Plant Required including crushing and milling – Mines 1 and 2 will feed new plant – Second new Processing Plant Required including crushing and milling – Mines 3 & 4 will feed second plant – Mine 5 will require crushing and milling and the Tailings plant will be utilised to process this ore
* This is a strategic target only, not a forecast or projection. Refer forward looking statement on page 2.
28
Transforming Gold Mining in South Africa | 2016
– Bring PMR into production – New processing plant required
– Bring Glynns Lydenburg Tailings dam into production – New Processing Plant Required, no crushing or milling
– Bring hard rock mines into production at 10 ktpm per mine – New Processing Plant Required including crushing, milling and BIOX – Mines 1 and 2 will feed new plant – Second new Processing Plant Required including crushing and milling and extension to BIOX – Mines 3 & 4 will feed second plant – Bring additional tailings into production
* This is a strategic target only, not a forecast or projection. Refer forward looking statement on page 2.
29
Transforming Gold Mining in South Africa | 2016
* This is a strategic target only, not a forecast or projection. Refer forward looking statement on page 2.
Ore source 2017 2018 2019 2020 2021 2022 2023 2024 2025 2026
Tailings
4,800 4,000 3,900 2400
28,800 44,200 66,600 77,200 77,200 77,200 77,200 Subtotal (Excluding PMR)
18,200 32,800 48,100 69,000 77,200 77,200 77,200 77,200 Ore source 2017 2018 2019 2020 2021 2022 2023 2024 2025 2026
Tailings
4,300 4,300 4,300 4,300 200
28,800 44,200 59,700 61,700 61,700 61,700 Subtotal (Excluding PMR)
17,700 33,100 48,500 64,000 61,900 61,700 61,700 30
Transforming Gold Mining in South Africa | 2016
* This is a strategic target only, not a forecast or projection. Refer forward looking statement on page 2.
Ore source 2017 2018 2019 2020 2021 2022 2023 2024 2025 2026
Tailings
9,100 8,300 8,200 6,700 4,300 200
42,200 73,000 110,800 136,900 138,900 138,900 138,900
Total
22,500 50,500 81,200 117,500 141,200 139,100 138,900 138,900
31
32 Transforming Gold Mining in South Africa | 2016
Transforming Gold Mining in South Africa | 2016 33
gold occurs in sedimentary host rocks of the Transvaal Supergroup.
disconcordant carbonate reefs in Malmani Dolomites in flat, bedding parallel shears located mainly on shale partings.
granites within a shear zone.
area, e.g. Frankfort – Bevett’s and Theta Reefs, Beta – Beta Reef, Duke’s Hill – Rho Reef. Hermansburg, DG2 and DG1 target surface gold mineralisation.
from the historical Vaalhoek Mine. Glynn’s Lydenburg and Elandsdrift tailings dumps comprise historically mined out and processed tailings from various regional gold mines.
34 Transforming Gold Mining in South Africa | 2016
Transforming Gold Mining in South Africa | 2016
35
Transforming Gold Mining in South Africa | 2016
36
The Arbitration against Shandong Qixing Iron Tower Co., Ltd is complete, awaiting an award, likely by end August 2016
Where: Hong Kong International Arbitration Centre The Claim: US$118.5 million Costs: Litigation funding Consortium (funded)
Key Process and Timeline:
Transforming Gold Mining in South Africa | 2016 37
Transforming Gold Mining in South Africa | 2016
38
(The other 26% interest in the subsidaries are owned by the local BEE groups)
Transforming Gold Mining in South Africa | 2016
Mineral Resource Category Type of Operation Tonnage Gold Grade Gold Content Mt g/t Kg 000 oz Measured UG 0.170 4.77 811 26.1 Surface 0.151 1.59 240 7.7 Tailings 2.294 0.77 1,770 56.9 Total Measured 2.615 1.08 2,821 90.7 Indicated UG 2.903 5.82 16,902 543.3 Surface 3.173 0.88 2,811 90.4 Tailings 0.012 0.58 7 0.2 Total Indicated 6.088 3.20 19,720 633.9 Total Measured & Indicated 8.703 2.59 22,541 724.6 Inferred UG 16.151 3.90 63,028 2,026.5 Surface 0.801 0.80 642 20.7 Tailings 2.124 3.06 6,503 209.0 Rock Dump 0.121 1.59 192 6.2 Plant Floats 0.041 0.54 22 0.7 Beta Main 0.109 0.81 88 2.8 Total Inferred 19.346 3.64 70,475 2,266.0
39
Transforming Gold Mining in South Africa | 2016
Continued Lab testwork for drill cores planned for Q2 of 2017
40
Project SW Minimum Tonnage Maximum Tonnage Minimum Grade Maximum Grade Minimum Ounces Maximum Ounces Cm Mt Mt g/t g/t Moz Moz TGME Mines: Vaalhoek 100 3.5 1.0 4.00 3.50 0.12 1.41 Beta 100 3.5 3.5 0.95 3.50 0.11 0.40 Sabie Mines Rietfontein 100 0.5 3.0 2.02 6.51 0.03 0.63 Glynn's 100 2.5 6.5 1.00 3.00 0.08 0.64 Total 100 10.1 24.1 1.03 3.97 0.33 3.07 The information in this Presentation that relates to Exploration Results, Exploration Targets, Mineral Resources or Ore Reserves is based on information compiled by Daniel van Heerden, who is currently employed as a Director and as Principal Mining Engineer by Minxcon Projects (Pty) Ltd. His qualifications include a B.Eng. (Mining) from the University of Pretoria in 1985 and a M.Com.(Business Administration) from Rand Afrikaans University (now UJ) in 1993. He is a member in good standing of the Engineering Council of South Africa and is registered as a Professional Engineer with registration no. 20050318 as well as a Fellow in good standing
a list promulgated by the ASX from time to time. He has worked as a Mining Engineer for more than 30 years with more than 20 years directly associated with gold mining specifically. Daniel van Heerden is employed by Minxcon and has sufficient experience which is relevant to the style of mineralization and type of deposit under consideration and to the activity which he is undertaking to qualify as a Competent Person as defined in the 2012 Edition of the ‘Australasian Code for Reporting of Exploration Results, Mineral Resources and Ore Reserves’. Daniel van Heerden consents to the inclusion in this Presentation of the matters based
Conceptual ounces in the exploration target
Refer forward looking statement on page 2. The Exploration Target is conceptual of nature, with low confidence and does not imply a resource
Transforming Gold Mining in South Africa | 2016 41
Competent Person: Vaalhoek - the two exploration targets that have been determined from the historical resource block
cmg/t. The average widths are 750 m and 1 120 m for the two target areas. The extent of the extension uses a maximum of 1 500 m and a minimum of 500 m which is roughly the width of the historical mining. This results in a potential tonnage of between 3.55 Mt and 10.96 Mt for the two target areas. The minimum grade has been based on the lowest category for the historical resource blocks (0 - 100 cmg/t) and the maximum grade is based on the highest category for the historical resource blocks (+400 cmg/t). Beta - The conceptual exploration target is based on the lateral extension of the Beta reef to the
expected to range between 95 cmg/t and 350 cmg/t (average of two drill holes in the area; from the current estimation model in that area).
Refer forward looking statement on page 2. The Exploration Target is conceptual of nature, with low confidence and does not imply a resource
Transforming Gold Mining in South Africa | 2016 42
Competent Person: Rietfontein - These target areas and ounces are based mainly on historical resource block information and the areas that have been targeted are those with historical resource data indicating values greater than 300 cmg/t or 3.00 g/t over a stoping width of 100 cm. This "cut off" was used as it is a possible economic cut off for this type of mining at shallow
these conceptual target areas are not based on semi- variogram ranges of the mineralised zones but rather
cmg/t or 3.00 g/t over a stoping width of 100 cm. Glynn's - The conceptual exploration targets (best potential at Glynn's), at Compound Hill and Malieveld, are based on the historical resource block data that was available. The lateral extent of these target areas are based on the historical blocks with a value greater than 300 cmg/t. The lengths for the three are 2 160 m, 630 m and 525 m respectively. The down dip extension is based on a minimum of 200 m which is approximately the extent of the historical mining and an average maximum of 500 m which is the optimistic view. The minimum value has been based on the lowest category for the historical resource blocks (0 - 100 cmg/t) and the maximum value is based on the highest category for the historical resource blocks (+300 cmg/t).
Refer forward looking statement on page 2. The Exploration Target is conceptual of nature, with low confidence and does not imply a resource
Transforming Gold Mining in South Africa | 2016
multiple mines (more than 1,500 samples) and testing for both grade and fractional analysis has shown the prevalence of the material across the mines
2.13 g/t albeit that this may vary from one area to the next
Area Historical Mined Area @ 93 % Minimum Tonnage Maximum Tonnage Minimum assumed Grade Maximum assumed Grade Minimum Estimated Gold Maximum Estimated Gold Minimum Estimated Gold Maximum Estimated Gold 000 000 m² Mt Mt g/t g/t Kg Kg Moz Moz Northern Division 1.87 2.55 5.17 1.28 2.13 3,250 10,992 0.104 0.353 Central Division 4.52 6.15 12.49 1.28 2.13 7,846 26,537 0.252 0.853 Southern Division 6.54 8.89 18.05 1.28 2.13 11,341 38,359 0.365 1.233 Total 12.94 17.60 35.71 1.28 2.13 22,436 75,888 0.721 2.440
43
Refer forward looking statement on page 2. The numbers is conceptual of nature, with low confidence and does not imply a resource
Transforming Gold Mining in South Africa | 2016
44
Refer forward looking statement on page 2. The numbers is conceptual of nature, with low confidence and does not imply a resource
Competent Person: PMR Exploration Target Methodology TGME has undertaken a study on the residual broken rock that historically had been packed in the old mining stopes. The historical mines that were accessible have been investigated to get an understanding of the potential of the "residue mining" in the historical operations. The investigations undertaken by the mine personnel at Beta and Theta mine revealed old mining areas packed with broken rock which has been sampled in places. Grade
consideration given to obtain a representative sample.
Volume
already existant in the current mining void. All historical mining areas have been assumed to contain material based on the areas investigated although it was not possible to investigate all the areas due to access restrictions.
were factorised by a packing of 80% for the stoping width and swelling factor of an additional 5%.
has been assumed that the broken density of the PMR represents approximately 65% of the possible unmined rock density of the reef (2.7 t/m³). Content
Transforming Gold Mining in South Africa | 2016
$0 $20,000,000 $40,000,000 $60,000,000 $80,000,000 $100,000,000 $120,000,000 $140,000,000
History & Future Value of Stonewall
Debt Market Capitalisation
Valuation - AUD90m; Long term debt - AUD Nil
Cap – AUD108m; Long term debt – AUD4m
Transaction phase: Market Cap – AUD120m; Long term debt – AUD7m
Consolidation phase: Market Cap – AUD10 - 15m; Long term debt – AUD12m
Market Cap – AUD20m - ??m; Long term debt – AUD6m
45
Transforming Gold Mining in South Africa | 2016
46