asx announcement
play

ASX ANNOUNCEMENT Results for the half year ended 31 December 2019 - PDF document

Enero Group Limited ABN 97 091 524 515 Level 2, 100 Harris Street Pyrmont NSW 2009 Australia t. +61 2 8213 3031 ASX ANNOUNCEMENT Results for the half year ended 31 December 2019 11 February 2020 Enero Group Limited (ASX: EGG) today announced


  1. Enero Group Limited ABN 97 091 524 515 Level 2, 100 Harris Street Pyrmont NSW 2009 Australia t. +61 2 8213 3031 ASX ANNOUNCEMENT Results for the half year ended 31 December 2019 11 February 2020 Enero Group Limited (ASX: EGG) today announced its results for the half year ended 31 December 2019. Summary  Net Revenue up 7% to $68.0m and Operating EBITDA up 10% to $11.0m.  Net Profit after tax pre significant items to equity holders of $5.8m.  Operating EBITDA margin improved to 16.2%, up 0.5bps.  Earnings per share before significant items down 6% to 6.8 cents.  Interim dividend declared of 2.5 cents, fully franked. 
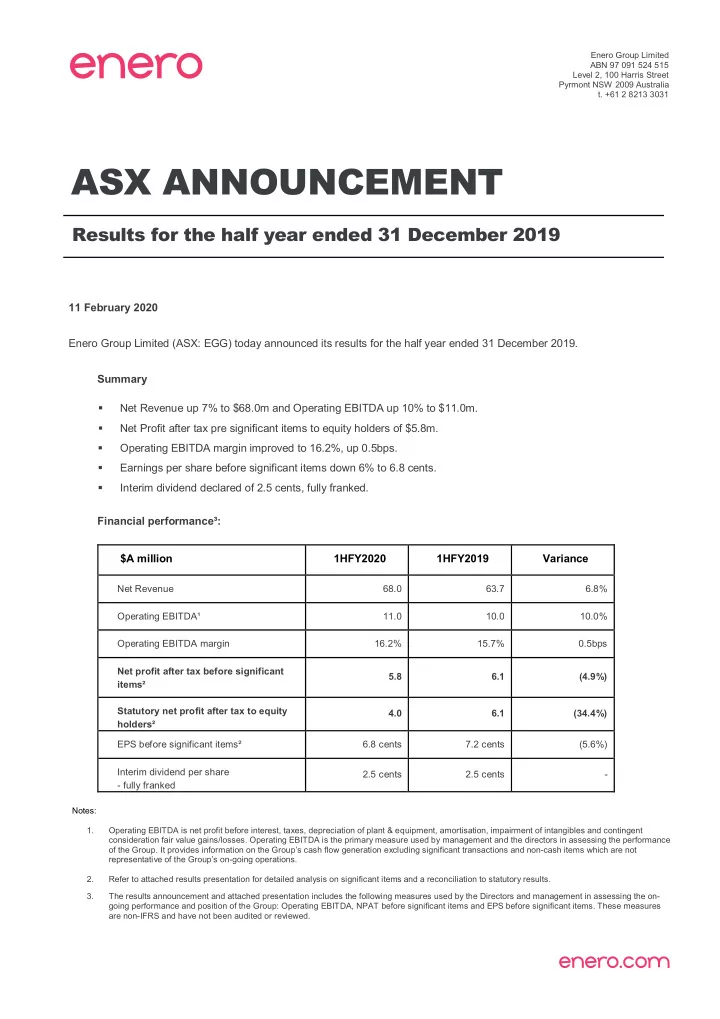
Financial performance³: $A million 1HFY2020 1HFY2019 Variance Net Revenue 68.0 63.7 6.8% Operating EBITDA¹ 11.0 10.0 10.0% Operating EBITDA margin 16.2% 15.7% 0.5bps Net profit after tax before significant 5.8 6.1 (4.9%) items² Statutory net profit after tax to equity 4.0 6.1 (34.4%) holders² EPS before significant items² 6.8 cents 7.2 cents (5.6%) Interim dividend per share 2.5 cents 2.5 cents - - fully franked Notes: 1. Operating EBITDA is net profit before interest, taxes, depreciation of plant & equipment, amortisation, impairment of intangibles and contingent consideration fair value gains/losses. Operating EBITDA is the primary measure used by management and the directors in assessing the performance of the Group. It provides information on the Group’s cash flow generation excluding significant transactions and non-cash items which are not representative of the Group’s on-going operations. 2. Refer to attached results presentation for detailed analysis on significant items and a reconciliation to statutory results. 3. The results announcement and attached presentation includes the following measures used by the Directors and management in assessing the on- going performance and position of the Group: Operating EBITDA, NPAT before significant items and EPS before significant items. These measures are non-IFRS and have not been audited or reviewed.

  2. Enero Group Chair, Ann Sherry said: “The Group delivered a very strong set of results for the half year, most importantly achieving organic revenue growth of 7% and delivering above benchmark margins. In my short time in the role, I have met many of the teams, particularly those in Sydney, and have been very impressed with their energy and enthusiasm. We are well underway with our CEO search to replace Matthew Melhuish, who will be leaving us on 31 March 2020. I am confident we are going to have some outstanding candidates to choose from’’. Business Operating Performance: Net Revenue was up 6.8% and Operating EBITDA was up 10% on the prior reporting period. International markets represented 52% of the Group’s Net Revenue and 59% of the Group’s Operating EBITDA. This half year represents the first half year reported under the new leasing accounting standards. Refer to the results presentation for a reconciliation of results compared to the prior reporting period and a summary of the ongoing impact on reporting. Prior period results were not re-stated under transition arrangements. Operating cash flow for the half year was to $12.9m and the Group is in a Net Cash position of $12.5m as at 31 December 2019. Refer to the results presentation for further details on operating business performance. Dividend: The Directors declared an interim dividend of 2.5 cents per share, fully franked. The interim dividend will have a record date of 28 February 2020 and a payment date of 19 March 2020. This announcement was authorised for release by the Board of Directors. About Enero: Enero Group is a boutique network of marketing and communications businesses listed on the ASX that includes creative agency BMF, PR agencies Hotwire, Frank and CPR, research consultancies The Leading Edge and The Digital Edge, digital agency Orchard and programmatic marketing specialist OBMedia. For more information, please visit www.enero.com. For further information please contact: Brendan York CFO t. +61 2 8213 3084 m. +61 402 217 617 brendan.york@enero.com Page 2

  3. ENERO GROUP FY20 HALF YEAR RESULTS 11 FEBRUARY 2020

  4. FY20 HALF YEAR HIGHLIGHTS Delivering growth Net Revenue up 6.8% to $68.0m. Operating EBITDA up 10.0% to $11.0m. Operating EBITDA margin at 16.2%, up 0.5%. Net Profit before significant items to equity holders down 4.9% to $5.8m¹. Earnings Per Share (EPS) before significant items down 5.6% to 6.8 cps. Cash flow conversion at 107% of EBITDA. Capital Management Interim dividend of 2.5 cps declared, fully franked, payable 19 March 2020. Balance sheet flexibility for contingent consideration payments and for future acquisitions enhancing geographical presence and expansion of services. Operational Client diversification providing access to targeted and higher growth sectors. New CEO search underway. 1. Refer to slide 8 for a reconciliation to statutory results. 3

  5. FY20 HALF YEAR HIGHLIGHTS Strategy Simplify, evolve and grow. The vision of Enero Group is to offer a client-centric alternative to traditional marketing holding companies and technology consulting companies by delivering bespoke end-to-end integrated solutions spanning the three most critical areas of any organisation’s long term success – brand, reputation and conversion. Our business units boast aligned but distinctive capabilities and are united via a three-tiered strategy: • A goal to reinvent every client brand as a technology brand, creating a large addressable market; • Building on our deep sector expertise in strategic, adjacent industries: enterprise and consumer technology, financial services, automotive, health, retail, tourism & destination marketing; and • A focus on maintaining true integration across different fields of expertise via the common language of User Experience, expressed as Brand Experience, Stakeholder Experience and Customer Experience. 4

  6. OPERATING COMPANIES Insight, Strategy, Creative & PR & Integrated Digital & Data & Analytics Content Communications Technology 5

  7. FY20 KEY FINANCIAL METRICS Half year ended 31 December ($M) Key Financial Metrics 2019 2018 Variance Net Revenue 68.0 63.7 6.8% Operating EBITDA¹ 11.0 10.0 10.0% Operating EBITDA margin² 16.2% 15.7% 0.5bp Net Profit after tax before significant items to equity holders³ 5.8 6.1 (4.9%) Statutory Net Profit after tax to equity holders³ 4.0 6.1 (34.4%) EPS before significant items³ 6.8 cents 7.2 cents (5.6%) EPS³ 4.7 cents 7.2 cents (34.7%) Dividend per share (interim) 2.5 cents 2.5 cents -% 1. Operating EBITDA is net profit before interest, taxes, depreciation of plant & equipment, amortisation, impairment of intangibles, contingent consideration fair value losses. 2. Operating EBITDA Margin is Operating EBITDA / Net Revenue. 3. Refer to slide 8 for a reconciliation to statutory results. 6

  8. FY20 GROUP FINANCIAL PERFORMANCE Revenue and Operating EBITDA Half year ended 31 December ($M) •7% Organic revenue growth (5% net of currency assistance). 2019 2018 Variance •Staff costs ratio holding at 68.6% (1HFY2019 - 68.4%) Staff costs includes all fulltime employees Net Revenue 68.0 63.7 6.8% and freelance/contractors. Variable staffing Net Revenue 68.0 63.7 6.8% allowing more flexibility to adjust cost base to revenue requirements. •Operating costs ratio (including right-of-use asset Operating EBITDA charge) down to 15.5% (1HFY2019: 16.0%) as Operating Companies 14.3 13.3 7.5% improvements in revenue and strong cost discipline across all businesses result in improved Support office (2.7) (2.9) 6.9% margins. Share based payments charge (0.6) (0.4) (50.0%) Operating EBITDA 11.0 10.0 10.0% Operating EBITDA margin 16.2% 15.7% 0.5bp 7

  9. FY20 GROUP FINANCIAL PERFORMANCE Half year ended 31 December ($M) Profit and Loss Summary 2019 2018 Net Revenue 68.0 63.7 Other Revenue 0.3 0.1 Staff costs (46.7) (43.6) Operating expenses (8.2) (10.2) Right-of- use assets depreciation charge⁴ (2.4) - Operating EBITDA¹ 11.0 10.0 Depreciation of plant & equipment (1.1) (1.0) Amortisation of intangible assets (0.5) (0.5) Net Interest 0.1 0.2 Present value interest charges – contingent consideration (0.7) (0.5) Present value interest charges – finance leases⁴ (0.4) - Income tax (1.4) (1.1) Non-controlling interests (1.2) (1.0) NPAT before significant items² to equity holders 5.8 6.1 Significant items³ (1.8) - Statutory Net profit after tax to equity holders 4.0 6.1 1. Operating EBITDA provides meaningful information on the Group’s cash flow generation excluding significant transactions and non-cash items which are not representative of the Group’s ongoing operations. 2. NPAT before significant items represents net profit after tax before the impact of significant, non-recurring and non-operational items. 3. Refer to slide 9 for significant items. 4. Represents new categories relating to the adoption of AASB16 Leases from 1 July 2019. The prior year comparatives have not been re-stated. Refer to slide 20. 8

  10. FY20 GROUP FINANCIAL PERFORMANCE Half year ended 31 December ($M) Significant Items 2019 2018 Contingent consideration fair value loss¹ (1.8) - Total significant items (1.8) - 1. The contingent consideration fair value loss is in relation to the re-assessment of future payments for the Eastwick Communications acquisition. 9

Download Presentation
Download Policy: The content available on the website is offered to you 'AS IS' for your personal information and use only. It cannot be commercialized, licensed, or distributed on other websites without prior consent from the author. To download a presentation, simply click this link. If you encounter any difficulties during the download process, it's possible that the publisher has removed the file from their server.

Recommend


More recommend