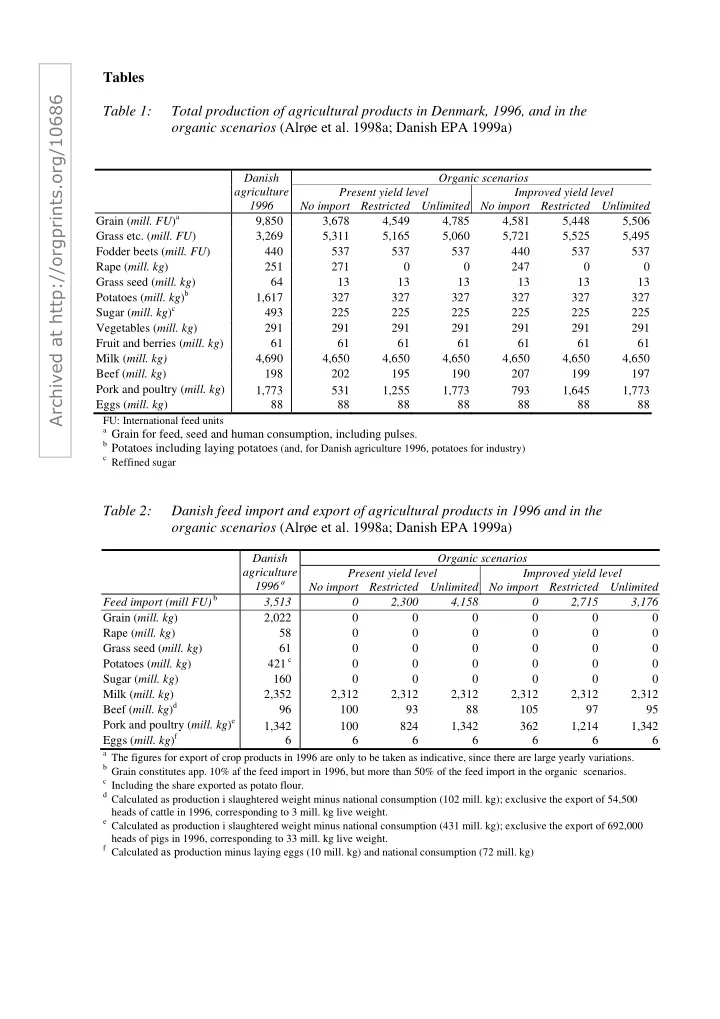
archived at http orgprints org 10686
play

Archived at http://orgprints.org/10686 Table 1: Total production of - PDF document

Tables Archived at http://orgprints.org/10686 Table 1: Total production of agricultural products in Denmark, 1996, and in the organic scenarios (Alre et al. 1998a; Danish EPA 1999a) Danish Organic scenarios agriculture Present yield level


  1. Tables Archived at http://orgprints.org/10686 Table 1: Total production of agricultural products in Denmark, 1996, and in the organic scenarios (Alrøe et al. 1998a; Danish EPA 1999a) Danish Organic scenarios agriculture Present yield level Improved yield level 1996 No import Restricted Unlimited No import Restricted Unlimited Grain ( mill. FU ) a 9,850 3,678 4,549 4,785 4,581 5,448 5,506 Grass etc. ( mill. FU ) 3,269 5,311 5,165 5,060 5,721 5,525 5,495 Fodder beets ( mill. FU ) 440 537 537 537 440 537 537 Rape ( mill. kg ) 251 271 0 0 247 0 0 Grass seed ( mill. kg ) 64 13 13 13 13 13 13 Potatoes ( mill. kg ) b 1,617 327 327 327 327 327 327 Sugar ( mill. kg ) c 493 225 225 225 225 225 225 Vegetables ( mill. kg ) 291 291 291 291 291 291 291 Fruit and berries ( mill. kg ) 61 61 61 61 61 61 61 Milk ( mill. kg) 4,690 4,650 4,650 4,650 4,650 4,650 4,650 Beef ( mill. kg ) 198 202 195 190 207 199 197 Pork and poultry ( mill. kg ) 1,773 531 1,255 1,773 793 1,645 1,773 Eggs ( mill. kg ) 88 88 88 88 88 88 88 FU: International feed units a Grain for feed, seed and human consumption, including pulses . b Potatoes including laying potatoes (and, for Danish agriculture 1996, potatoes for industry) c Reffined sugar Table 2: Danish feed import and export of agricultural products in 1996 and in the organic scenarios (Alrøe et al. 1998a; Danish EPA 1999a) Danish Organic scenarios agriculture Present yield level Improved yield level 1996 a No import Restricted Unlimited No import Restricted Unlimited Feed import (mill FU) b 3,513 0 2,300 4,158 0 2,715 3,176 Grain ( mill. kg ) 2,022 0 0 0 0 0 0 Rape ( mill. kg ) 58 0 0 0 0 0 0 Grass seed ( mill. kg ) 61 0 0 0 0 0 0 Potatoes ( mill. kg ) 421 c 0 0 0 0 0 0 Sugar ( mill. kg ) 160 0 0 0 0 0 0 Milk ( mill. kg ) 2,352 2,312 2,312 2,312 2,312 2,312 2,312 Beef ( mill. kg ) d 96 100 93 88 105 97 95 Pork and poultry ( mill. kg ) e 1,342 100 824 1,342 362 1,214 1,342 Eggs ( mill. kg ) f 6 6 6 6 6 6 6 a The figures for export of crop products in 1996 are only to be taken as indicative, since there are large yearly variations. b Grain constitutes app. 10% af the feed import in 1996, but more than 50% of the feed import in the organic scenarios. c Including the share exported as potato flour. d Calculated as production i slaughtered weight minus national consumption (102 mill. kg); exclusive the export of 54,500 heads of cattle in 1996, corresponding to 3 mill. kg live weight. e Calculated as production i slaughtered weight minus national consumption (431 mill. kg); exclusive the export of 692,000 heads of pigs in 1996, corresponding to 33 mill. kg live weight. f Calculated as p roduction minus laying eggs (10 mill. kg) and national consumption (72 mill. kg)

  2. Table 3: Nitrogen balances in 1996, after the implementation of the plan for the aquatic environment (VMP 2), and in the organic scenarios (mill. kg per year) <Grant 1998; Danish EPA 1999b> Danish VMP 2 Organic scenarios agriculture Present yield level Improved yield level 1995/96 No import Restricted Unlimited No import Restricted Unlimited Feed , etc. 205 179 6 94 148 18 109 122 Art. fertilizer 285 177 0 0 0 0 0 0 Sludge, waste 9 9 0 0 0 0 0 0 Atm. deposition a 57 57 57 57 57 57 57 57 159 b 159 b 159 b 177 b 177 b 177 b Fixation 30 31 N input 586 452 222 310 364 253 343 357 Crop products 63 42 19 19 19 19 19 19 Animal products 105 105 58 82 100 66 96 100 N output 168 147 76 100 118 85 114 119 N balance 418 305 146 209 245 167 229 238 Ammonia loss c 76 69 45 57 67 50 65 67 N to the soil, net 342 236 101 152 178 117 164 171 a The same atmospheric deposition is used in all scenarios, not incorporating the consequences of the changes in ammonia loss following from the changes in livestock. b An estimate for the uncertainty on the size of the fixation in the organic scenarios has been calculated to 56 mill. kg. c The calculation is based on etimates for N ab anima, estimates for ammonia loss and denitritficaiton in housings and stocks, in the delivery of manure, and in grazing. These losses are dependent on the production system. Furthermore there is a loss of ammonia from crops (11 mill. kg). In 1995/96 and the VMP 2 scenario there is furthermore a loss from artificial fertilizer (7 mill. kg) and from the ammonia treatment of straw (4 mill. kg). Table 4: Consumption of fossil energy in Danish agriculture and the organic scenarios, compared with crop and animal production <Dalgaard et al. 1998, Danish EPA 1999b>. Danish Organic scenarios agriculture Present yield level Improved yield level 1996 No import Restricted Unlimited No import Restricted Unlimited Crop product. ( mill. FU) 15,900 11,000 11,400 11,600 12,300 12,800 12,900 Crop product. ( PJ ME) a 199 138 143 145 154 160 161 Number of animals ( mill. 2.3 1.7 2.1 2.4 1.9 2.3 2.4 Livestock Units ) Energy for crop production ( PJ ) 37 17 17 17 17 17 17 Energy for animal production ( PJ ) 41 13 29 41 14 31 37 Total energy 78 30 46 58 31 49 54 consumption ( PJ ) 14 b Energy production ( PJ ) 0 0 0 0 0 0 Net consumption ( PJ ) 64 30 46 58 31 49 54 a Converted from feed units to metabolic energy (1 FU = 12,5 MJ ME). b There is a potential for further energy production in the present agriculture, corresponding to the grain that was exported in 1996 (2000 mill. kg * 15 MJ/kg = 30 PJ). The use of this potential will have other socioeconomic consequences.

  3. Overall structure of the material flows in a model of an all-organic agriculture in Denmark Feed input LIVESTOCK Feed Nutrient CROPS cattle, pigs, poultry input Animal products grass clover, cereals, Manure row crops, vegetables, fruit Crop products

  4. The model for calculation of the organic scenarios. Livestock Crops Total production area Total danish in rotation and production of Production data from permanent grassland Total production fruit and berries Crop composition and free-range and organic of eggs rotations on Danish egg production organic farms Total area in Total production rotation and Feed ration and Number of of fruit, berries permanent grassland egg production Animal and vegetables hens Crop composition for hens husbandry feed and rotation needs Rules on free-range and organic production Area with fruit, berries and Free-range Free-range Area of specific vegetables area for sows area per sow crops in Surplus products from rotation Total production food industries of pork Danish consump- tion of crop products Number of Organic yields Use of surplus sows in fruit, berries products for feed Production data on Feed ration and and vegetables free-range Available grain, production for Yields on Prod. of crops production of pigs sows and pigs etc. for pigs permanent for consumption grassland 3 levels of import of feed Rules for organic Grass-clover to Organic yields in feed and medication 2 levels of Available grain, sows and pigs agricultural and default crop etc. for feed horticultural practice yields in model Production of and experiments Available different crops for grass-clover for Available feed feed to cows grass-clover for feed 3 different feed Number of cows Faktor for rations and milk Adjusted grain in 3 groups Available beets adjusment of yields for cows yields for feed corn yields Manure from Total number animal Feed consumption of cows Crop nutrient Manure distri- Manure available husbandry and milk yields in needs bution to crops for grain Total milk organic dairy Danish national production production EC milk quota Total beef production 2 different feed Key to model symbols Manure from rations for studs recycled waste Share of cows and products heifers, and number of Decision Model Empirical Input or studs, for slaughter variable variable variable output variable Production data from organic dairy farms Types and amounts and beef production of waste products Model calculation flow in society Use of empirical data

  5. The relation between the modelling proces and the value inquiry in an assessment like the one performed by the Bichel Committee Empirical data Basic presumptions The model The scenario results The vision of the future state Value inquiry concerning the future state

  6. Three elements in the development of organic agriculture: practice, preferences, and rules – all related to the basic organic principles and values as well as to conventional practice The conventional agricultural practice The organic agricultural practice Societal and consumer preferences Rules and regulations of organic for organic products and practice agricultural practice The basic principles and values of organic farming

Download Presentation
Download Policy: The content available on the website is offered to you 'AS IS' for your personal information and use only. It cannot be commercialized, licensed, or distributed on other websites without prior consent from the author. To download a presentation, simply click this link. If you encounter any difficulties during the download process, it's possible that the publisher has removed the file from their server.

Recommend


More recommend