Applications of Water Footprint Methodology as a Decision Support - - PowerPoint PPT Presentation

applications of water footprint methodology as a decision
SMART_READER_LITE
LIVE PREVIEW

Applications of Water Footprint Methodology as a Decision Support - - PowerPoint PPT Presentation

2020 International Conference on the Nile and Grand Ethiopian Renaissance Dam: Science, Conflict Resolution and Cooperation FIU Institute of Environment, the Addis Ababa Institute of Technology, Addis Ababa University and the Bahir Dar Institute


slide-1
SLIDE 1

Applications of Water Footprint Methodology as a Decision Support Tools for Water Management Tasks in Egypt

1,2Rasha El Gohary 1 Central Laboratory for Environmental Quality Monitoring, National Water Research Center, NWRC,

MWRI, Cairo, Egypt.

2 El-Gezera Higher Institute for Engineering & Technology, Ministry of Higher Education, Egypt;

Email: rm.elgohary@yahoo.com,drrasha.elgohary@gi.edu.eg

2020 International Conference on the Nile and Grand Ethiopian Renaissance Dam: Science, Conflict Resolution and Cooperation

FIU Institute of Environment, the Addis Ababa Institute of Technology, Addis Ababa University and the Bahir Dar Institute of Technology, Bahir Dar University. August 20-21, 2020

2020 International Conference on the Nile and Grand Ethiopian Renaissance Dam: Science, Conflict Resolution and Cooperation

slide-2
SLIDE 2

RESEARCH OUTLINE

1- Introduction to Water Footprint

II-The National Water-Food &Trade NWFT

3- Conclusions

I-Egyptian water foot print and food security

4- Recommendations 2- Egyptian National Water, Food, and Virtual Water Trade Modeling

2020 International Conference on the Nile and Grand Ethiopian Renaissance Dam: Science, Conflict Resolution and Cooperation

slide-3
SLIDE 3

1-Water resources in Egypt

More than 96 percent of all the Egyptian fresh water resources are supplied by the river Nile, which originates from outside the country boundaries and supplies ten countries among which Egypt. Egypt s share of Nile water is limited according to the 1959 international agreement between Sudan and Egypt at 55.5 BCM (Abu-Zeid, 1991). The rest of the water requirements is met by a renewable groundwater with 4.8 BCM/year and a drainage water reuse, which is estimated at 4.5 BCM. Treated municipal and industrial wastewater water returns to the closed water system 0.7 and 6.5 BCM, respectively (UN CCA, 2001). Water Resources of Egypt

3

slide-4
SLIDE 4

Water Footprint / Virtual Water

The term “virtual water” (VW) is generally used to refer to the sum of water used

  • r consumed

in the various steps

  • f

the production processes

  • f

a commodity(Allan, 2003). It is generally agreed that both VW and the WF are measures of direct and indirect water consumption and only account for freshwater appropriation. It has been suggested that an important distinction between the two concepts is that a WF “does not simply refer only to a water volume, as in the case of the term virtual water content ‘of a product”, instead the WF is a “multidimensional indicator, not only referring to a water volume used, but also making explicit where the water footprint is located, what source of water is used and when the water is used” (Hoekstra et al., 2011).

Introduction to Water Footprint

2020 International Conference on the Nile and Grand Ethiopian Renaissance Dam: Science, Conflict Resolution and Cooperation

slide-5
SLIDE 5

Green water footprint

► Refers to the volume of rainwater consumed (i.e. evaporated or absorbed into the

product).

Blue water footprint

► Refers to the volume of surface water and ground water consumed during production processes (i.e. evaporated or absorbed into the product).

Grey water footprint

► Refers to the volume of freshwater that is required to eliminate the load of

  • pollutants. It is calculated as the volume of water that is required to maintain the water

quality according to agreed water quality standards

Components of a water footprint

Water footprint as an indicator of human consumption of freshwater resources can be measured as volume over time (mostly m3/yr). A country’s water footprint is the volume of water used to produce goods and services consumed by the inhabitants of a country, including imported goods be measured as volume over time over per capita (mostly m3/yr/capita). .

Water footprint

2020 International Conference on the Nile and Grand Ethiopian Renaissance Dam: Science, Conflict Resolution and Cooperation

slide-6
SLIDE 6

Table Average virtual water content of some selected products for a number of selected countries (m3/ton).

USA

China India Russia

Indonesia Australia

Brazil Japan Mexico

Italy

Netherlands

World Average

Rice (paddy) 1275

1321

2850 2401 2150 1022 3082 1221 2182 1679 2291 Rice (husked) 1656 1716 3702 3118 2793 1327 4003 1586 2834 2180 2975 Rice (broken) 1903 1972 4254 3584 3209 1525 4600 1822 3257 2506 3419 Wheat 849 690 1654 2375 1588 1616 734 1066 2421 619 1334 Maize 489 801 1937 1397 1285 744 1180 1493 1744 530 408 909 Soybeans 1869 2617 4124 3933 2030 2106 1076 2326 3177 1506 1789 Sugar cane 103 117 159 164 141 155 120 171 175 Cotton seed 2535 1419 8264 4453 1887 2777 2127 3644 Cotton lint 5733 3210 18694 10072 4268 6281 4812 8242 Barley 702 848 1966 2359 1425 1373 697 2120 1822 718 1388 Sorghum 782 863 4053 2382 1081 1609 1212 582 2853 Coconuts 749 2255 2071 1590 1954 2545 Millet 2143 1863 3269 2892 1951 3100 4534 4596 Coffee (green) 4864 6290 12180 17665 13972 28119 17373 Coffee (roasted) 5790 7488 14500 21030 16633 33475 20682 Tea (made) 11110 7002 3002 9474 6592 4940 9205 Beef 13193 12560 16482 21028 14818 17112 16961 11019 37762 21167 11681 15497 Pork 3946 2211 4397 6947 3938 5909 4818 4962 6559 6377 3790 4856 Goat meat 3082 3994 5187 5290 4543 3839 4175 2560 10252 4180 2791 4043 Sheep meat 5977 5202 6692 7621 5956 6947 6267 3571 16878 7572 5298 6143 Chicken meat 2389 3652 7736 5763 5549 2914 3913 2977 5013 2198 2222 3918 Eggs 1510 3550 7531 4919 5400 1844 3337 1884 4277 1389 1404 3340 Milk 695 1000 1369 1345 1143 915 1001 812 2382 861 641 990 Milk powder 3234 4648 6368 6253 5317 4255 4654 3774 11077 4005 2982 4602 Cheese 3457 4963 6793 6671 5675 4544 4969 4032 11805 4278 3190 4914 Leather (bovine) 14190 13513 17710 22575 15929 18384 18222 11864 40482 22724 12572 16656 6

slide-7
SLIDE 7

Product Virtual water content (litres) Product Virtual water content (litres) 1 glass of beer (250 ml) 75 1 glass of wine (125 ml) 120 1 glass of milk (200 ml) 200 1 glass of apple juice (200 ml) 190 1 cup of coffee (125 ml) 140 1 glass of orange juice (200 ml) 170 1 cup of tea (250 ml) 35 1 bag of potato crisps (200 g) 185 1 slice of bread (30 g) 40 1 egg (40 g) 135 1 slice of bread (30 g) with cheese(10 g) 90 1 hamburger (150 g) 2400 1 potato (100 g) 25 1 tomato (70 g) 13 1 apple (100 g) 70 1 orange (100 g) 50 1 cotton T-shirt (medium sized, 500 g) 4100 1 pair of shoes (bovine leather) 8000 1 sheet of A4-paper (80 g/m2) 10 1 microchip (2 g) 32

Table Global average virtual water content of some selected products, per unit of product

Virtual water content of processed crop and livestock products

7

slide-8
SLIDE 8

The water footprint of a country can be related to the population. The result is the national average water footprint in m³ per person in one year (m³/person/year). The worldwide average is about 1240 m³/cap/yr. The majority is used by food and other agricultural products (86%). The calculations of national net virtual water balances

( virtual water imported – virtual water exported ) showed that developed countries generally have a more stable virtual

water balance than the developing countries. Countries that are relatively close to each other in terms of geography and development level can have a rather different virtual water balance. Germany, the Netherlands and the UK are net importers whereas France is a net exporter. USA and Canada are net exporter whereas Mexico is a net importer.

WFP(m3/cap/yr) 600 - 800 800 - 1000 1000 - 1200 1200 - 1300 1300 - 1500 1500 - 1800 1800 - 2100 2100 - 2500 No Data

[Hoekstra & Chapagain, 2008]

slide-9
SLIDE 9

2- Egyptian National Water, Food, and Virtual Water Trade Modeling

I- Food Production and Trade in Egypt

Wheat, maize, and rice are the primary food crops in Egypt. The per capita supplies of wheat, maize, and rice in Egypt have increased substantially since the 1960s, even though the population has grown from about 30 million to 100 million. Those increases have been made possible by improvements in agricultural technology, policy reforms that have encouraged farmers to enhance productivity, and increasing imports of wheat and maize. Imports of food and fodder crops, and the virtual water contained in those crops, have contributed to Egypt’s ability to maintain food security. However, Egyptian farmers also produce large amounts of water-intensive and low-valued crops for both domestic production and export. Hence, virtual water is imported and exported from Egypt through its involvement in international trade. Domestic production of wheat and maize has been increasing somewhat sharply since the middle 1980s (Wichelns 2001) (Figure a, b).

2020 International Conference on the Nile and Grand Ethiopian Renaissance Dam: Science, Conflict Resolution and Cooperation

slide-10
SLIDE 10
  • Figure. Production, import and export of: wheat (a), maize (b), rice (c) and cotton (d) (El-Sadek, A., 2010).

Virtual Water Trade in Egypt as a Policy Option

In 2010, the cereal baseline demand is 29.982 × 10⁶ tons with increase of 20.69% to 2007 situation where this baseline demand will be 33.887 × 10⁶ tons with increase of 36.41% in 2017. Faced with this situation, a critical question that the country has to face is how to safeguard its long term food security with the limited water resources. The main concern, here, is to apply the concept of virtual water, as a strategy, in a way that meets its interest and needs, having in mind the main

  • bjectives of the National Water Resources Plan until 2017.

2020 International Conference on the Nile and Grand Ethiopian Renaissance Dam: Science, Conflict Resolution and Cooperation

slide-11
SLIDE 11

Figure : Virtual water balance per country and direction of gross virtual water flows related to trade in agricultural and industrial products over the period 1996–2005. Countries with net export Virtual water flows (Gm3/yr) Countries with net import Virtual water flows (Gm3/yr) Export Import Net export Import Export Net import Australia 73 9 64 Japan 98 7 92 Canada 95 35 60 Italy 89 38 51 USA 229 176 53 United Kingdom 64 18 47 Argentina 51 6 45 Germany 106 70 35 Brazil 68 23 45 South Korea 39 7 32 Ivory Coast 35 2 33 Mexico 50 21 29 Thailand 43 15 28 Hong Kong 28 1 27 India 43 17 25 Iran 19 5 15 Ghana 20 2 18 Spain 45 31 14 Ukraine 21 4 17 Saudi Arabia 14 1 13

2020 International Conference on the Nile and Grand Ethiopian Renaissance Dam: Science, Conflict Resolution and Cooperation

slide-12
SLIDE 12
slide-13
SLIDE 13

Average annual total virtual water crop and livestock trade between Nile Basin states and the rest of the world, 1998- 2004 (mm3/y).

Zeitoun et al. make the following

  • bservations about trade flows and

water dependence: The Nile Basin may be divided into net importers and net exporters .The figure shows that the Southern Nile states as well as Ethiopia and Eritrea actually export more virtual water in crops and livestock than they import. Egypt and Sudan, by contrast, are net importers. Virtual water imports from outside the basin appear to be of a great and growing significance to the lower Nile Riparians – Egypt and Sudan.

slide-14
SLIDE 14

II - The National Water, Food, and Trade (NWFT) Modeling

The National Water, Food, and Trade (NWFT) modeling framework, consists of two parallel-running components The first component, The national water-food (NWF) model was built using the system dynamics approach (Ford, 1999).The NWF model runs with an annual time step and comprises three interlinked modules: (I) crop and animal production, (II) food consumption, and (III) water resources system. The second component, the global virtual water trade (VWT) model, characterizes the annual virtual water trade between Egypt and the rest of the world, which is here grouped into nine regions. The two models are not coupled, but rather running in parallel for the purpose of identifying discrepancies or issues at the global scale that might be worth attention from policy makers at the national scale

Figure Simplified schematic diagram of the NWFT modeling framework (A. Abdelkader, et al., 2018).

slide-15
SLIDE 15

A- The National Water-Food (NWF) Component

The national water-food (NWF) model was built using the system dynamics approach (Ford, 1999), which uses stocks, flows, interactions and feedback loops to represent system elements and their relations. The NWF model runs with an annual time step and comprises three interlinked modules: (I) crop and animal production, (II) food

consumption, and (III) water resources system.

1- Crop and animal production module

For a total of 78 crops (72 food crops, 3 non-food crops, and 3 fodder crops), harvested areas (ha) and yields (tonne/ha) were obtained per year for the period 1986–2013 from (FAO 2017b). Egypt's annual production (tonne/y) per crop was calculated. Production of animal products was calculated with a similar approach used for crop production. Animal feed is the major component that contributes to the total water footprint of animal production. In Egypt, the major feed crop is berseem (Egyptian clover), followed by concentrate feeds that are mainly composed of grains. In addition, animals and animal products require drinking and service water (m3/ head), which was obtained for Egypt from (Chapagain and Hoekstra 2003). The production of food crops and animal products were added to get national food production (tonne/y).

2020 International Conference on the Nile and Grand Ethiopian Renaissance Dam: Science, Conflict Resolution and Cooperation

slide-16
SLIDE 16
  • 2. Food consumption module

The food crops and animal products considered in the consumption module of the NWF model are 81 items. This is more than those in the production module because of imported food products, which are consumed but not produced in Egypt. The consumed food mix (kg/y/capita) in Egypt was obtained from the food balance sheets by (FAO 2017b). The national food consumption (kg/y) for each food item is calculated . Green and blue water footprints (m3/tonne) of crops and animal products consumed and produced in Egypt were

  • btained from (Mekonnen and Hoekstra 2011, 2012), and then used to calculate the water footprints of production

and consumption (m3/y). Surplus or deficit were calculated and assumed to be equivalent to Egypt's exports and imports, respectively. The exports and imports were calculated in terms of product trade (tonne/y) and virtual water trade (m3/y). The modules of production and consumption were configured based on Egypt's food balance sheet provided by (FAO 2017b) over the historical record (1986–2013), and no calibration parameters were needed.

  • 3. Egypt's water resources system module

The water resources system module is a national-scale water accounting and allocation model. The annual municipal water use was calculated based on the population and the municipal water use rate (m3/y/capita). The irrigation system efficiency is known to range from 44%–66% (IWMI, 2013), with improvement over time due to the improvement in irrigation methods and technologies.

2020 International Conference on the Nile and Grand Ethiopian Renaissance Dam: Science, Conflict Resolution and Cooperation

slide-17
SLIDE 17

National scenarios

Egypt's Ministry of Water Resources and Irrigation (MWRI, 2010) developed three future scenarios, Critical, Balanced, and Optimistic, regarding water resources supply and demand in Egypt till 2050. The scenarios consider various water and socioeconomic combinations in their

  • formulation. Variables considered are:

(1) Possible increase in Nile water inflow from projects of water saving in upstream countries, (2) Different levels of internal water resources development of shallow and deep groundwater, reuse of drainage water, desalination, rainfall harvesting, and evaporation losses from the surface irrigation system, (3) Socioeconomic variables, such as population and industrial growth, and (4) Policy variables, such as agricultural land expansion and municipal water use reduction.

Reference scenario was added, which represents business as usual, with no significant changes

relative to the past trends.

slide-18
SLIDE 18

Referencea Critical Balanced Optimistic Uncertainty range Annual population growth rate 2% 2% 1.8% 1.65% ±10% Food consumption pattern Unchanged Unchanged Increase in veg. & fruits (20%) and meat (26%), decrease in cereals (4%) Increase in veg. & fruits (20%) and decrease in cereals (2.6%) Unchanged Increase in available water resources over the period 2013–2050 (109 m3/y)a +2.42 Nile flow + 0 +6.82 Nile flow + 0 +8.82 Nile flow + 2 +13.82 Nile flow + 4 ±5% Shallow GW + 1.9 Shallow GW + 1.9 Shallow GW + 1.1 Shallow GW + 1.1 ±10% Deep GW + 0 Deep GW + 1.63 Deep GW + 1.63 Deep GW + 1.63 ±20% Reuse +0 Reuse +2 Reuse −2.3 Reuse +4.8 ±20% Desalination + 0 Desalination + 0.77 Desalination + 1.27 Desalination + 1.77 ±50% Rain harvesting + 0.02 Rain harvesting + 0.02 Rain harvesting + 0.02 Rain harvesting + 0.02 ±30% Evaporation + 0.5 Evaporation + 0.5 Evaporation + 0.5 Evaporation + 0.5 ±20% Municipal water demand (m3/y/capita)a From 114 in 2013 to 79 by 2050 From 114 in 2013 to 79 by 2050 From 114 in 2013 to 82 by 2050 From 114 in 2013 to 82 by 2050 0% to −50% (114 to 57) Annual growth in industrial water use (%) 0% 0.65% 1% 1.35% ±50% Agriculture water consumption (m3/Feddan) 4700 (unchanged) From 4700 to 4500 From 4700 to 4400 From 4700 to 4300 ±5% Irrigation efficiency 63% (unchanged) From 63% to 65% From 63% to 70% From 63% to 75% ±10% Agriculture expansion (million Feddan) No increase Increase to 10 Increase to 10.8 Increase to 11.8 ±20% for the target Land productivity (tonne/Feddan) Unchanged Unchanged Unchanged Unchanged ±20% Annual animal growth rate Unchanged Unchanged Increased to match increase Unchanged ±20%

slide-19
SLIDE 19

Figure Egypt’s baseline and projected (a) national food production, (b) total domestic food supply (national food consumption), (c) national food gap (imports), and (d) national water gap (A. Abdelkader, et al., 2018).

National water-food (NWF) model results

NWF model simulates Egypt's food production and consumption and its food and water gaps for the baseline period 1986– 2013 and the future up to 2050. In all scenarios, the increase of food production is projected to be slower than that of the baseline period due to the limitation of fresh water availability (Figure).Under all scenarios, Egypt's food and water gaps are projected to widen with rates higher than those of the baseline period. This occurs because the negative effect of the low rate of production and high population growth rate. (a) national food production

(b) total domestic food supply (national food consumption

(c) national food gap (imports) (d) national water gap.

slide-20
SLIDE 20

Figure Egypt's (a) food self-sufficiency, and (b) water self-sufficiency (A. Abdelkader, et al., 2018).

As noted earlier, and shown in Figure , population growth has a dramatic effect on Egypt's food and water gaps. The 15 million tonne reduction in the food gap in 2050 can be achieved by lowering the population growth rate from 2.0% to 1.79%. Figure shows the extreme case

  • f lowering Egypt's annual population growth to the current level of some European nations (0.5%), and its huge impact on the national

food gap. This is a strong indication that investment in educational, health, and awareness programs for lowering the population growth rate can be a major part of the solution of Egypt's severe water problems.

(a) food self-sufficiency (b) water self-sufficiency

slide-21
SLIDE 21

B- Virtual Water & Trade (VWT) model

The main purpose of this model is to characterize the virtual water trade into and out of Egypt. Therefore, there is less emphasis on individual countries, and thus, countries were integrated into nine regions to make the model and its links smaller and more parsimonious. The country under consideration, Egypt in this study, is kept as an

  • individual. The nine regions are: Africa (AF), Middle East and North Africa (ME), East Asia and Pacific (EA),

South Asia (SA), Central Asia (CA), Europe (EU), North America (NA), Latin America and Caribbean (LA), and Oceania and New Zealand (OC). The data between 1986 and 2011 were used for the VWT model because it is the time frame within which all data were available. Population and agricultural production and consumption-related data are available publicly through the (FAO 2017b). The blue and green water footprint of each product (m3/tonne) was obtained from (Mekonnen and Hoekstra 2011) and multiplied by the production quantity (tonne) to calculate the water footprint of each product (m3). The water footprint of all food produced and consumed were summed up, then divided by the population to calculate WFPand WFC, respectively. The GDP data were obtained from the (UN 2017). The VWT model was developed and evaluated based on the baseline period (1986–2011), then it was used to project the future VWT up to 2050 using the future socioeconomic shared pathways (SSPs).

2020 International Conference on the Nile and Grand Ethiopian Renaissance Dam: Science, Conflict Resolution and Cooperation

slide-22
SLIDE 22

Global scenarios / Shared Socioeconomic Pathways (SSPs)

The climate change research community developed five scenarios of global societal development, called the shared socioeconomic pathways (SSPs) (O'Neill et al., 2017). These SSPs consider changes in demographics, economy and lifestyle, policies, technology, natural resources, and human development for distinguishing the five scenarios. IIASA (2016) provides the population, gross domestic product and urbanization data of all SSPs for all countries for the period of 2000–2100. Data on population (P) and gross domestic product (GDP) were extracted for all countries up to year 2050 and processed to match the ten world regions distinguished in this study. The future values of water footprint of agricultural production (WFP) are unknown for each region. These values depend on many factors that vary by region, like the water resources availability, the agriculture policy and management decisions, and the degree of development and technology. So, an ideal way to estimate WFP is to develop a model like NWF for every country in the world and simulate the future values based on assumptions for the controlling factors Two different experiments were adopted. Experiment I, data on WFP per region (expressed in m3/y/capita) at the end of the baseline period (2011) were assumed to remain constant up to the year 2050. This implies that each region attempts to keep the food production per capita at the level of 2011, assuming that the water footprint of production in every region keeps pace with regional population growth. Experiment II, even if resources availability is not a problem for some regions ,other factors like water quality and socioeconomic factors might make them fail to maintain 2011 levels of per capita food production. Hence, some other regions would increase their per capita food production over 2011 levels to trade more food. In this experiment the per capita WFp is assumed to be varying, for some regions it will increase while decrease for others. The annual WFPseries up to 2050 were generated for all SSPs in the ten regions. Finally, the VWT model was used to generate the virtual water (food) imports of Egypt till year 2050 under the five SSPs.

slide-23
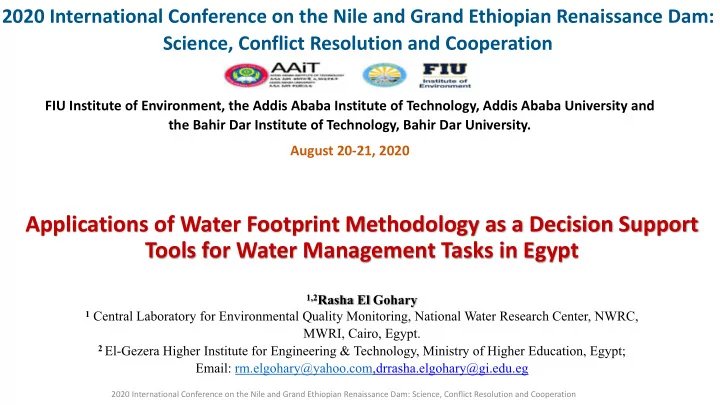
SLIDE 23

Figure . The baseline and projected future virtual water imports of Egypt under the five SSPs, (a) Experiment I: constant WFP in the future and (b) Experiment II: varying WFP values based on stabilized food waste in the future

Virtual Water & Trade (VWT) model results

The VWT model was fed with the IIASA's SSPs to project Egypt's imports till 2050. In experiment I, when the WFP (m3/capita) was kept constant in the future in all regions, Egypt's virtual water import increased from 76 up to 135 × 109 m3/y by 2050, with an average value of 103× 109 m3/y (Figure a). This constant future value

  • f WFP implies a significant increase in Egypt's production over the years to match the pace of population growth, and thus, imports can be kept to the lowest possible
  • level. However, this future scenario may not be realistic as the VWT model generated unrealistically high or low waste and stock variations to keep the global

food balance between exporting and importing regions. In experiment II, the generated WFP values (m3/capita) increased in certain regions (e.g. Eastern Europe and North America) and decreased in others (e.g. Middle East and South Asia) in the future, and we find this to be more realistic due to advancement in technology and the differences in population growth rates among the world's regions. The new projections of Egypt's imports are shown in Fig. b. The imports range from 127 to 232 × 109 m3/y by 2050 with an average value of 195 × 109m3/y in 2050.We also find the projections to be reasonable as the lowest imports projections of Egypt, in other words exports to Egypt from the other nine regions, happen in SSP3 and SSP4, characterized by global fragmentation and inequality where policies are oriented towards security, including barriers to trade . On the other hand, the highest imports are found for SSP5, the conventional development scenario .Egypt's virtual water imports are projected to increase from all regions.

(a) Experiment I: constant WFP in the future

(b) Experiment II: varying WFP values based on stabilized food waste in the future

slide-24
SLIDE 24
  • Figure. Virtual water (food) imports of Egypt over the baseline period and the projected future under various national and global scenarios, (a) Experiment I: constant WFP values

in the future and (b) Experiment II: varying WFP values based on stabilized food waste in the future (A. Abdelkader, et al., 2018).

(a) Experiment I: constant WFP values in the future (b) Experiment II: varying WFP values based on stabilized food waste in the future The general pattern and trend of Egypt's food imports projected by both the global and national models in the NWFT modeling framework (Fig. 11). However, taking into consideration an average value of the five SSPs, the VWT model estimates Egypt's food import in year 2050 to be 150 million tonne, which is 39% higher than the average estimate resulting from the national model (averaging the four national scenarios). SSP4 provides a close estimate to the national model, with an estimated food import in 2050 that is 8% lower than the average of the national scenarios. In Egypt, it is useful and important to ensure that the national 2050 strategy and its associated future scenarios can be made possible from a global perspective, which can be assessed using the VWT model to a reasonable level. If Experiment I (Fig. 11a) provides the realistic global picture, it means that Egypt projected future food needs are far beyond what is anticipated based on the global food availability and trade network. In this case, it is an alarming situation that requires introducing serious policy instruments that can change Egypt's food gap.

slide-25
SLIDE 25

q A set of future scenarios of Egypt's water and socioeconomic conditions up to the year 2050 were evaluated using the national water-food (NWF) model, and they all revealed that Egypt is facing the challenge of widening food and water gaps. However, there are scenarios that were assessed to be more optimistic than others, and those ones require investments to develop some internal water resources through desalination, the use of fossil groundwater, improving irrigation and municipal water efficiency , and lowering the population growth rate. The sensitivity analysis revealed that the exceptionally high population growth rate in Egypt plays a critical role in pushing the national water and food gaps to alarming levels. q The NWFT modeling framework can be easily adapted to other countries and also to expand the nexus to other sectors, such as energy This allows more integrated planning, development, policy-making, monitoring and evaluation of the nexus sectors. The same approach could be used to develop national sustainability strategies for multiple sectors.

3- Conclusions

2020 International Conference on the Nile and Grand Ethiopian Renaissance Dam: Science, Conflict Resolution and Cooperation

slide-26
SLIDE 26

q In Egypt, the water shortage experience is not related only to increasing demand, but rather also to poor infrastructure and management practices. The water sector in Egypt is facing many challenges including water scarcity and deterioration of water quality due to population increase and lack of financial resources. q Agriculture in Egypt suffers from low productivity, old technological, low incomes for farmers, low exporting vision. Policy making should invest in agricultural education and technology (which in turn would increase productivity), and in turn influence the agriculture water productivity that influence economic development in the country. q It is a strong indication that investment in educational, health, and awareness programs for lowering the population growth rate can be a major part of the solution of Egypt's severe water problems , also this is not enough alone but also awareness towards : ( Dietary energy consumed ( consume fruits and vegetable instead of meat and wheat , decrease the food waste is important for developed countries like Egypt .

2020 International Conference on the Nile and Grand Ethiopian Renaissance Dam: Science, Conflict Resolution and Cooperation

slide-27
SLIDE 27

q The NWFT modeling framework presented in this study has a few limitations that are worth further improvements in future studies. First, the NWF model can benefit from more including more socioeconomic factors, like for instance food prices. Explicit accounting of the food prices, which might affect the national consumption both in pattern and quantity, can affect the, country's imports. Second, the NWF model of Egypt's water-food nexus can be extended to include energy. Currently, because of the limited contribution of hydropower and the small amounts of cooling water for thermal power, relative to other water uses, and the negligible use of Egyptian crops in bioenergy, the energy role in the nexus is limited. Nonetheless, there is a considerable input of energy in water and food supply, mainly due to the use of fertilizers and machinery in agriculture and pumping systems in irrigation and water extraction. Also, an increase in desalination can enhance the need to include energy. q It is recommend to take the virtual water as a major tool in Egyptian national strategic plan 2050 also apply NWT framework with parallel to NWF and take into account the energy , crop cost , benefit cost ratio , and food waste scenarios

4- Recommendations

2020 International Conference on the Nile and Grand Ethiopian Renaissance Dam: Science, Conflict Resolution and Cooperation

slide-28
SLIDE 28

q There is some agricultural water footprint and little to no industrial water footprint in the Egypt it is recommended to Increase the industrial component used in virtual water to increase the water income as Egypt consume more than 86% of fresh water resources in agriculture while average water productivity from agriculture equal 3 USD for cubic meter while it is 22 USD/m3 in Algeria , 84 USD/m3 in Bahrain , 37 USD/m3 in Kuwait , and 137 USD/m3 in Israel .. q Waste per capita was studied and it is concluded that it will increased 3 times in 2050 while water foot print

  • decreases. It is recommended to study the capital waste and different Dietary Diets in Egyptian strategic plan

2050 and to develop waste management technology ,recycle techniques , and Biogas technology. q The virtual water trade within the Nile Basin is dominated by tea and coffee trade. Yet trade between the Nile Basin states is small by comparison to fresh water imports from outside the Basin. Intra-basin virtual water crop trade is about 2.3% of virtual water imported by all states. Virtual water imported by the Basin states from

  • ther Basin states in the form of livestock is about 1.1% of the amount imported from the rest of the world. It

is highly recommend to increase the trade between the basin countries especially Egypt as the biggest importer in the Nile Basin . Egypt should invest in the Nile Basin country specially in agriculture this investment would, in turn, lead to higher agricultural outputs and decreasing water food gab.

2020 International Conference on the Nile and Grand Ethiopian Renaissance Dam: Science, Conflict Resolution and Cooperation

slide-29
SLIDE 29