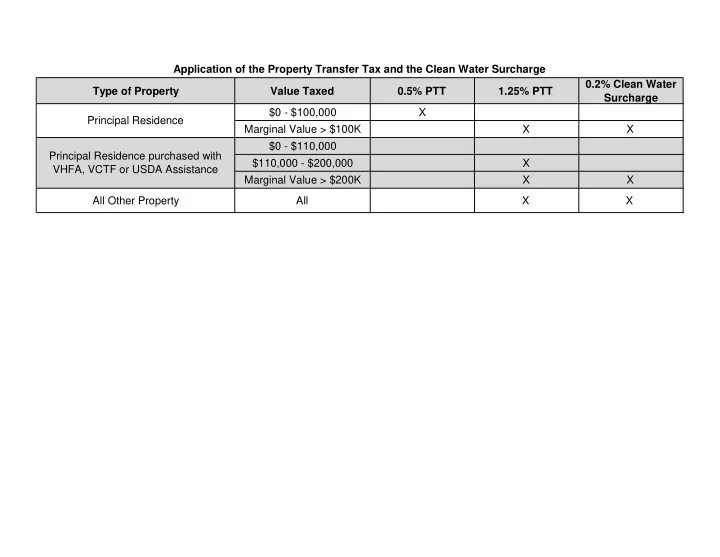

Application of the Property Transfer Tax and the Clean Water Surcharge 0.2% Clean Water Type of Property Value Taxed 0.5% PTT 1.25% PTT Surcharge $0 - $100,000 X Principal Residence Marginal Value > $100K X X $0 - $110,000 Principal Residence purchased with $110,000 - $200,000 X VHFA, VCTF or USDA Assistance Marginal Value > $200K X X All Other Property All X X
Property Transfer Tax - Statutory Distribution PTT Forecast 100% $100 Tax Dept Remaining 2% 98% $2 $98 GF HCTF MRPF 33% 50% 17% $32 $49 $17 Municipal RPC's GIS 20% 70% 10% $3 $12 $2 Property Transfer Tax Distribution 2.0% Dedicated to Tax Department [2000 Act 152 Sec.271e.; 2011 No.45 Sec.35 and 37(10); and 2016 No.172 Sec. D.100.1] 98.0% Remainder dedicated as follows: 33.0% General Fund [32 VSA 435(b)(10)] 50.0% Housing Conservation Trust Fund (HCTF) [10 VSA § 312] 17.0% Municipal Regional Planning Fund (MRPF) [24 VSA § 4306(a).] 32.3% Effective General Fund Share of Total 49.0% Effective HCTF Share of Total 16.7% Effective MRPF Share of Total 17.0% MRPF further dedicated as follows: [24 VSA § 4306(a).] 70.0% Regional Planning Commissions 20.0% Competitive Municipal Planning 10.0% Geographic Information Systems 16.7% Effective MRPF Distribution of Total 11.7% Regional Planning Commissions 3.3% Competitive Municipal Planning 1.7% Geographic Information Systems 0.20% Clean Water Surcharge 32 V.S.A. § 9602a. VT LEG #159648 v.6
Property Transfer Tax Appropriations/Formula MRPF Formula TOTAL Tax GF HCTF MRPF GIS Muni RPC 1% 33% of 99% 50% of 99% 17% of 99% 10% 20% 70% 1,240,661 FY10 - Formula 23,800,000 238,000 7,775,460 11,781,000 4,005,540 400,554 801,108 2,803,878 FY10 - Actual 23,800,000 221,000 14,216,613 6,101,662 3,260,725 408,700 219,998 2,632,027 6,441,153 FY11- Formula 25,642,860 256,429 8,377,522 12,693,216 4,315,693 431,569 863,139 3,020,985 FY11 - Actual 25,642,860 233,000 15,858,771 6,101,662 3,449,427 408,700 408,700 2,632,027 7,481,249 FY12 - Formula 24,298,505 485,970 7,858,137 11,906,267 4,048,131 404,813 809,626 2,833,692 FY12 Actual 24,298,505 488,000 12,467,529 8,047,500 3,295,476 378,700 408,700 2,508,076 4,609,392 FY13 - Formula 28,310,018 566,200 9,155,460 13,871,909 4,716,449 471,645 943,290 3,301,514 FY13 Actual 28,310,018 582,000 10,743,902 13,688,640 3,295,476 378,700 408,700 2,508,076 FY14 - Formula 30,930,638 618,613 10,002,968 15,156,013 5,153,044 515,304 1,030,609 3,607,131 FY14 Actual 30,930,638 518,000 12,811,484 14,014,000 3,587,154 378,700 449,570 2,758,884 FY15 - Formula 33,622,293 672,446 10,873,450 16,474,924 5,601,474 560,147 1,120,295 3,921,032 FY15 -Actual 33,622,293 518,000 14,388,854 14,954,840 3,760,599 378,700 457,482 2,924,417 FY16 - Formula 35,627,293 712,546 11,521,867 17,457,374 5,935,507 593,551 1,187,101 4,154,855 FY16 - Actual 35,627,293 518,000 21,793,854 9,554,840 3,760,599 378,700 457,482 2,924,417 Difference (658,134) 10,271,987 (7,902,534) (2,174,908) (214,851) (729,619) (1,230,438) FY17 Jan 2017 39,400,000 788,000 12,741,960 19,306,000 6,564,040 656,404 1,312,808 4,594,828 FY17 - as passed 39,400,000 518,000 23,816,561 11,304,840 3,760,599 378,700 457,482 2,924,417 Difference 11,074,601 11,074,601 (8,001,160) (2,803,441) (277,704) (855,326) (1,670,411) FY18 Jan 2017 41,900,000 419,000 13,688,730 20,740,500 7,051,770 705,177 1,410,354 4,936,239 FY18 Gov rec 41,900,000 518,000 25,316,561 12,304,840 3,760,599 378,700 457,482 2,924,417 Difference 11,627,831 11,627,831 (8,435,660) (3,291,171) (326,477) (952,872) (2,011,822) Prepared by JFO VT LEG #159648 v.6
Clean Water Surcharge FY16 Actuals and Forecast July (Actual) August September October November December January February March April May June Forecast 443,808 488,094 386,132 433,011 372,135 461,651 270,714 229,748 299,144 343,213 410,721 511,631 Actuals 280,039 275,048 550,297 488,366 426,821 348,065 442,522 285,465 484,754 231,572 339,652 497,252 Forecast Cumulative Month 443,808 931,902 1,318,034 1,751,045 2,123,179 2,584,830 2,855,544 3,085,292 3,384,435 3,727,648 4,138,369 4,650,000 Actual Cumulative Month 280,039 555,087 1,105,384 1,593,750 2,020,571 2,368,636 2,811,158 3,096,623 3,581,377 3,812,949 4,152,601 4,649,853 Cum Dollar Difference (163,770) (376,815) (212,650) (157,295) (102,609) (216,194) (44,386) 11,331 196,941 85,301 14,232 (147) Cum % Difference -37% -40.44% -16.13% -8.98% -4.83% -8.36% -1.55% 0.37% 5.82% 2.29% 0.34% 0.00% Clean Water Surcharge: FY17 Monthly Forecast July (Actual) August September October November December January February March April May June Forecast Month 471,438 506,796 410,661 456,291 392,142 486,471 285,268 242,100 315,227 361,665 432,803 539,138 Actual Month 471,438 359,016 313,732 666,484 289,733 190,121 559,596 397,508 Forecast Cumulative Month 471,438 978,235 1,388,896 1,845,187 2,237,329 2,723,800 3,009,068 3,251,168 3,566,394 3,928,060 4,360,862 4,900,000 Actual Cumulative Month 471,438 830,455 1,144,187 1,810,670 2,100,403 2,290,524 2,850,120 3,247,628 Cum Dollar Difference - (147,780) (244,709) (34,517) (136,926) (433,275) (158,948) (3,540) Cum % Difference - -15% -18% -2% -6% -16% -5% 0%
Recommend
More recommend