
SLIDE 1
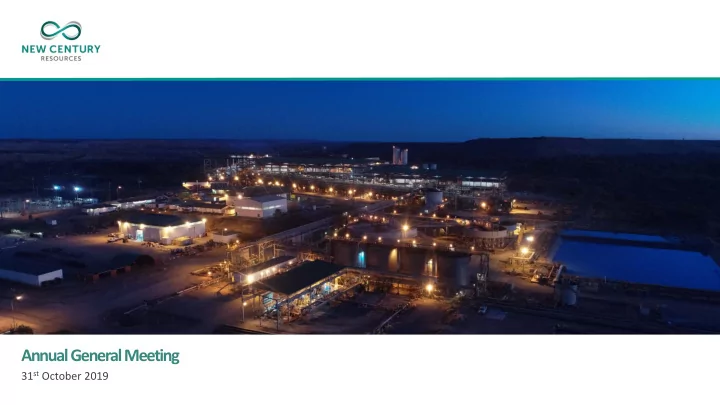
Annual General Meeting
31st October 2019
Century Zinc Mine Processing Plant
Annual General Meeting 31 st October 2019 Century Zinc Mine - - PowerPoint PPT Presentation
Annual General Meeting 31 st October 2019 Century Zinc Mine Processing Plant CautionaryStatement New Century Resources believes that the production target, forecast financial information derived from that target and other forward looking
Annual General Meeting
31st October 2019
Century Zinc Mine Processing Plant
ASX: NCZ
CautionaryStatement
New Century Resources believes that the production target, forecast financial information derived from that target and other forward looking statements included in this presentation are based on reasonable grounds. However, neither the Company nor any other person, including Sedgman Pty Ltd makes or gives any representation, assurance or guarantee that the production target or expected outcomes reflected in this announcement in relation to the production target will ultimately be achieved. Investors should note that the Company believes the commodity prices, AUD:USD exchange rate and other variables that have been assumed to estimate the potential revenues, cash flows and other financial information are based on reasonable grounds as at the date of this presentation. However, actual commodity prices, exchange rates and other variables may differ materially over the contemplated mine life and, accordingly, the potential revenue, cash flow figures and other financial information provided in discussions set out in this announcement should be considered as an estimate only that may differ materially from actual results. Accordingly, the Company cautions investors from relying on the forecast information in this announcement and investors should not make any investment decisions based solely on the results. A number of key steps need to be completed in order to bring the Century Zinc Mine to full scale production. Many of those steps are referred to in this presentation and previously released Restart Feasibility Study announcement. Investors should note that if there are any delays associated with completing those steps, or completion of the steps does not yield the expected results, the revenue and cash flow figures may differ materially from actual results. To achieve the range of outcomes indicated in this presentation, additional funding in the order of A$63 million will likely be required to achieve full production above the initial A$50 million capital outlay to bring the project into initial
that such funding may only be available on terms that may be dilutive to or otherwise affect the value of the Company’s existing shares. Certain statements contained in this presentation constitute forward looking statements. Forward looking information often relate to statements concerning New Century Resources’ future outlook and anticipated events or results and, in some cases can be identified by terminology such as “may”, “will”, “could”, “should”, “expect”, “plan”, “anticipate”, “believe”, “intend”, “estimate”, “projects”, “predict”, “potential”, “continue” or other similar expressions concerning matters that are not historical facts. Statements of historical fact are not considered forward looking information. Forward looking statements are based on a number of material factors and assumptions, including, but not limited in any manner to, those disclosed in results; the ability to explore; communications with local stakeholders and community and government relations; status of negotiations of joint ventures; weather conditions; Ore Reserves; Mineral Resources; the development approach and schedule; the receipt of required approvals, titles, licenses and permits; sufficient working capital to develop and operate the mines and implement development plans; access to adequate services and supplies; foreign currency exchange rates; access to capital markets; availability of qualified work force; ability to negotiate, finalise and execute relevant agreements; lack of social opposition to mines or facilities; lack of legal challenges with respect to the property; the timing and amount of future production and ability to meet production, operating and capital cost expenditure targets; timing and ability to produce studies and analysis; execution of the credit facility; ability to draw under the credit facility and satisfy conditions precedent including execution of security and construction documents; economic conditions; availability of sufficient funding; the ultimate ability to mine, process and sell the mineral products produced; the timing, exploration, development, operational, financial, budgetary, economic, legal, social and political factors that may influence future events or operating conditions. Forward looking statement are only predictions based on New Century Resources’ current expectations and projections of future events. Actual results may vary from such forward looking information for a variety of reasons. Forecast financial information provided in this presentation is based on the Restart Feasibility Study. The Company is of the view it has reasonable grounds for providing the forward looking statements included in this presentation. However, the Company cautions that there is no certainty that the forecast financial information derived from the production targets will be realised. The Company confirms that all material assumptions underpinning the production target and forecast financial information contained in the Company’s ASX Announcements on 28 November 2017 and 15 January 2018 continue to apply and have not materially changed. Other than required by law, New Century Resources assumes no obligation to update any forward looking information to reflect, among other things, new information or future events.
2
ASX: NCZ
InvestmentHighlights
3
Company Overview
infrastructure (concentrate pipeline, port & ship)
remains on schedule and budget
Production
9Mtpa
production, ~30% q-on-q for 12 months
smelters on 3 different continents
Guidance
at C1 costs of US$0.99/lb
performance): 10,013t zinc at C1 cost of US$0.90/lb
27,000t – 33,000t zinc at C1 costs of US$0.87 – $0.98/lb
ASX: NCZ
CorporateOverview
4
BOARD & MANAGEMENT CAPITAL STRUCTURE
Chairman
Rob McDonald
Managing Director
Patrick Walta
Non-Executive Directors
Nick Cernotta Peter Watson Evan Cranston
Company Secretary
Oonagh Malone
COO
Barry Harris
CFO
Mark Chamberlain
CBDO
John Carr
Shares on Issue
637M
Unlisted Options
(range A$0.25 - A$1.99, av. price A$0.45/sh)
117M
Market Capitalisation
(at A$0.37/sh)
A$235M
Cash & Debt
cash & receivables# working cap. facility (100% drawn) A$53M A$60M
# Cash & receivables as at 30 September 2019 comprising $45M in cash and $8M in fully contracted zinc concentrate awaiting shipment ASX: NCZ
Strategic Regional Infrastructure-Processing & Transport
5
Century infrastructure 100% owned, fully permitted &
MINE SITE INFRASTRUCTURE
LOGISTICS INFRASTRUCTURE
Century infrastructure is the only economic route for transport
ASX: NCZ
Community Engagement Highlights
6
Providing training and development opportunities for local Aboriginal people
NEW CENTURY COMMUNITY PROGRAMS UNDERWAY
Mornington Island Community Literacy Program:
top of normal daily classroom reading (55 students)
Kapani Warrior Program:
Century funding the Program setup in Doomadgee township
visits, mentoring roles, leadership training, army base visits)
Battalion (including paid employment) Cowboys House Mentor:
indigenous youth to access secondary education in Townsville
Winterstein appointed to role of mentor
increased retention of students at school
zinc metal produced for the
Sep)
quarter-on-quarter metal increase
USD per pound payable zinc C1 cost for Sep. Q (inc. $0.90/lb in month of Sep)
quarter-on-quarter cost reduction
September 2019 Quarter Performance
ASX: NCZ
CenturyProduction Ramp Up Progress
8
Achieved September quarter production guidance: 26,171t zinc metal
0.0 1.0 2.0 3.0 4.0 5.0 6.0 7.0 8.0 9.0
10,000 15,000 20,000 25,000 30,000 35,000
Q1 FY19 Q2 FY19 Q3 FY19 Q4 FY19 Q1 FY20 Q2 FY20*
Annualised Mining Rate (Mtpa) Zinc Metal Production (t)
Zinc Metal Production Annualised Mining Rate (Mtpa) 20 25 30 35 40 45 50 55 60
100 150 200 250 300 350
Zinc Recovery (%) Zinc Metal Production (t/operating day)
Zinc Recovery (%)
^ October 2019 estimated to the end of month based on performance to date * Q2 FY20 guidance based on scheduled ramp up process Q2 FY19 Q3 FY19 Q4 FY19 Q1 FY20
Average of 30% quarter-on- quarter metal production increase over last 12 months 58% increase of average daily metal production rate since May 2019
ASX: NCZ
DrivingCosts Lower
9
Achieved September quarter cost guidance: US$0.99/lb payable metal including TCs
0.00 0.25 0.50 0.75 1.00 1.25 1.50 1.75
Q1 FY19 Q2 FY19 Q3 FY19 Q4 FY19 Q1 FY20 Q2 FY20
US$/lb
TC Component of C1 C1 Costs Zinc Price
deductions) through to refined metal. Payable metal basis. ^ Q2 FY20 guidance based on scheduled ramp up process. Consensus Economics data used for zinc price projection (average of 28 investment bank projections).
$0 $50 $100 $150 $200 $250 $300
TC per tonne of concentrate (US$)
Spot Treatment Charges
Spot TC
Spot TCs remain at 10 year highs, expected to trend down with increasing Chinese smelter production
Source: Wood Mackenzie & Internal Company data October 2019
LOM C1 Cost Target Average of 15% quarter-on-quarter decrease in C1 costs over last 12 months (despite increasing TCs)
ASX: NCZ
Focusedon Improved Operational Performance
10
Ramping up to 9Mtpa then focused on optimising recovery performance via the cleaner and circuit upgrades
ASX: NCZ
Focusedon Improved Operational Performance
11
Targeting continued recovery optimisation and ramp up to 9Mtpa for 2019 & 12Mtpa ramp up in early 2020
Zn Roughers Zn Scavengers Zn Scavengers Ball Mill 03 Ball Mill 02 SAG Mill Zn Cleaner 1A Zn Cleaner 1B
Zn Cleaner 2A Zn Cleaner 3A Zn Clnr 4A Zn Cleaner 2B Zn Cleaner 3B Zn Clnr 4B
UFMs
Operational To be Recommissioned L e ge nd: Not under refurbishment
Stage 1: ONLINE (August 2019) Bringing Cleaner 2B online removes bottleneck for efficient 8-9Mtpa operations, 3B and 4B for 12Mtpa cleaner capacity (for future ramp up) Stage 2: ONLINE (October 2019) Additional scavenger flotation capacity online for further increased recoveries and throughput
Zn Roughers
Stage 3: March 2020 Commissioning 2nd rougher train allows expansion to 12Mtpa in conjunction with fourth mining cannon
Pathway to 12Mtpa: Processing Plant Overview
Hydraulic Mining Operations
Three cannons now online, only ~8% of the total ore body mined to date
1: Mining with three cannons 2: Screening & Pumping 3: Processing
Processing Plant Operations
Century operations are now an established top 15 zinc producer
ASX: NCZ
Port & Shipping Operations
14
Century logistics have already completed 17 shipments to 3 continents and 7 different smelters
Reclaiming of Stockpiled Concentrate Zinc Concentrate Exports MV Wunma Transhipper Karumba Port Facility
ASX: NCZ
ZincProducer Comparison
15
Based on Woodmac 2019 annualised forecast production (updated to Q2 2019) & Century’s annualised Century ramp up performance to date
Top Global Zinc Mines
1 Red Dog Teck 547 kt 2 Rampura Agucha Hindustan Zinc 475 kt 3 Mt Isa Glencore 380 kt 4 Antamina BHP, Glencore, Teck, Mitsu. 320 kt 5 McArthur River Glencore 280 kt 6 San Cristobal Sumitomo Corporation 260 kt 7 Dugald River MMG 170 kt 8 Sindesar Khurd Vedanta 170 kt 9 Tara Boliden AB 145 kt 10 Vazante Nexa Resources 142 kt 11 Penasquito Newmont Goldcorp 140 kt 12 Gamsberg Vedanta 135 kt 13 Cerro Lindo Nexa Resources 128 kt 14 Bisha Zijin Mining 125 kt
15 Century New Century Resources 120 kt
Top Australian Zinc Mines
1 Mt Isa Glencore 380 kt 2 McArthur River Glencore 280 kt 3 Dugald River MMG 170 kt
4 Century New Century Resources 120 kt
5 Rosebery MMG 90 kt 6 Broken Hill Perilya 77 kt 7 Cannington S32 60 kt 8 Mungana Denham Capital 50 kt 9 Golden Grove EMR Capital 40 kt 10 Jaguar Washington Soul Pattison 33 kt 11 Rasp Toho Zinc 30 kt 12 Mt Garnet Consolidated Tin Mines 26 kt 13 Thalanga Red River Resources 21 kt 14 Endeavor Toho Zinc 19 kt 15 Woodlawn Heron Resources 17 kt
ASX: NCZ
Zinc Demand Forecast: Consistent Consumption Growth
17
Forecast continued growing zinc metal demand 10 Year Zinc Outlook
China
2030
required just to meet demand growth (supply attrition extra)
USA, 7% India, 5% Other (all <5%), 39% China, 48%
Zinc Consumption by Country
Galvanizing, 60% Other, 2% Semi- Manufactured Products, 5% Chemicals, 9% Brass & Bronze Casting, 11% Die-casting Alloys, 13%
Zinc Consumption by First Use
Source: Wood Mackenzie, June 2019
ASX: NCZ
Zinc MetalSupply: No Stocks to Absorb Demand Increase
18
Zinc metal stocks at record lows –strong fundamentals with price subdued by sentiment
stocks to record lows
years ago)
unable to absorb any future demand increase
ASX: NCZ
Zinc ConcentrateMarket: Questionable New Mine Supply
19
Consistent delays in major projects coming online –potential for progressive concentrate market tightness
10,000 11,000 12,000 13,000 14,000 15,000 16,000 17,000 2010 2015 2020 2025
SOURCES OF FUTURE MINE PRODUCTION
Probable New Projects Existing Mine Production Forecast Zinc Demand
kt Zn
Source: Wood Mackenzie, July 2019
# Probable projects defined as in financing or bankable feasibility study development stage, excludes projects already under construction (already included in Existing Mine Production)
* Tala Hamza zinc production recently revised down to 60ktpa
Economic ‘window’ for large scale new project financing & construction has passed
Historical Forecast
Forecast Probable# >100ktpa Zinc Ops. Since 2017 Zinc Prod. (ktpa) Est. Capex (USD)
Delay in scheduled mine start from 2017 estimate to 2019 estimate
2018 2019 2020 2021 2022 2023 2024 Century (New Century)
233 <$100M
ONLINE
Kipushi (Ivanhoe)
225 $400M
Mehdiabad (Mobin Mining)
400 $1,000M
Citronen (Ironbark Zinc)
200 $500M
Tala Hamza (Terramin)
175* $350M
Dari (NFC)
130 $175M
Aznalcollar (Groupo Mexico)
100 $350M
Pavlovskoye (Rosatom)
150 $400M
Huoshaoyun (Xinjiang Zinc)
400 $1,500M
Selwyn (Chihong Zinc)
450 $1,900M
Ozernoe (Metropol)
350 $1,500M
TOTAL
(ex Century)
2,580 $8,075M >US$8,000M investment required over next 5 years for projects in DRC, Iran, Greenland, Russia, etc Continued new project delays, new supply highly unlikely
ASX: NCZ
Zinc ConcentrateSupply: New Mines Take Time
20
Century infrastructure (sunk capital) was the key to successful fast tracking of production
1980 1985 1990 1995 2000 2005 2010 2015 2020
Red Dog Rampua Agucha Cayeli McArthur River Cannington Lisheen Century Antamina Mt Garnet Skorpion Duck Pond San Cristobal Cerro Lindo Jaguar Rapu Rapu Perseverance Penasquito Campo Morado Angas Pirquitas Terrafame Wolverine Bolaños Fresnillo Saucito Rasp Lalor Lake Al Masane Bracemac-McLeod Escobal Perkoa Bisha Silvertip Soremi Guojiagou Dugald River Gamsberg Century Restart
Scoping work Feasibility work Construction
development timelines are increasing
proposition for exposure to large scale zinc production
Zinc Mine Development Timelines
(Average timeline from scoping study to operations)
All Zinc Projects Since 2000 9 Years Current Top 10 Zinc Producers 13 Years Century Restart 1 Year
Source: Wood Mackenzie, June 2018
ASX: NCZ
CenturyMineral Reserves & Resources
22
Century Mineral Reserves & Resources
CURRENT IN-SITU MINERAL RESOURCES 9.4Mt at 10.7% Zn+Pb (6.1% Zn, 4.6% Pb & 65g/t Ag)
Tenement Map
ASX: NCZ
ExpansionStudy Summary
23
In-situ resources delivering up to A$422M in additional free cash flow above current tailings operations
Case 12Mtpa Tailings 10Mtpa Tailings + 2Mtpa South Block & East Fault Block1 10Mtpa Tailings + 2Mtpa South Block & East Fault Block + Silver King1 Life of Mine
7 years (completed mid-2026)
Ore Mined (Mt)
72.3 80.0 81.9
Open Pit Strip Ratio2 (kt)
8.1
Zinc Metal Recovered (kt)
1,293 1,563 1,630
Lead Metal Recovered (kt)
159
Silver Metal Recovered (kOz)
11,876 17,488 18,909
Zinc Conc. Produced (kt)
2,639 3,126 3,261
Lead Conc. Produced (kt)
230
Technical Parameters (Life-of-Mine)
0.73 USD:AUD used for FY20 and then 0.70 for every subsequent year.
exchange rate and treatment charge assumptions as well as considering current depletion of the Ore Reserve and existing tailings ramp up progress.
Commercial Parameters3
Case8 12Mtpa Tailings4 10Mtpa Tailings + 2Mtpa South Block & East Fault Block 10Mtpa Tailings + 2Mtpa South Block & East Fault Block + Silver King Net Smelter Revenue (A$M)
3,504 4,432 4,949
C1 Cost5 (US$/lb payable Zn)
0.56 0.55 0.50
Capex (A$M)6
40 95 137
Sustaining Capital (A$M)7
127
EBITDA (A$M)
1,704 2,102 2,404
Free Cash Flow after tax (A$M)
1,128 1,365 1,549
NPV8 (A$M)
879 1,024 1,146
Incremental IRR9
80%
cash operating costs include all mining, processing, transport, treatment costs and smelter recovery deductions through to refined metal.
through integrated mining and rehabilitation of the waste rock dumps.
ASX: NCZ
Mining& Production Profiles
24
Addition of in-situ resources extend strong zinc production profile and includes a new lead product
2 4 6 8 10 12 14 2020 2021 2022 2023 2024 2025 2026 Ore Throughput, Mtpa Financial Year
Ore Throughput
50 100 150 200 250 300 2020 2021 2022 2023 2024 2025 2026 Zinc Production, ktpa Zn metal Financial Year
Zinc Metal
10 20 30 40 50 2020 2021 2022 2023 2024 2025 2026 Lead Production, ktpa Pb metal Financial Year
Lead Metal
1,000 2,000 3,000 4,000 5,000 2020 2021 2022 2023 2024 2025 2026 Silver Production, kOzpa Financial Year
Silver (as credit in Zn and Pb conc.)
At 10Mtpa tailings + 2Mtpa in-situ:
& lead concentrates Mine Life Extension:
15Mtpa tailings only case, now with mine life extension out to mid-2026
ASX: NCZ
CenturyTailings & In-situ Economic Projections
25
Growing earnings profile –significant of tailings operational deriskingachieved
0.00 0.10 0.20 0.30 0.40 0.50 0.60 0.70 0.80 2020 2021 2022 2023 2024 2025 2026 C1 Cost, USD$/lb payable Zn Financial Year
Life-of-Mine C1 Cost
12Mtpa Tailings 10Mtpa Tailings + SB/EFB 10Mtpa Tailings + SB/EFB + SK
100 200 300 400 500 2020 2021 2022 2023 2024 2025 2026 EBITDA, A$M Financial Year
EBITDA
Tailings Operations:
A$250M-A$300Mpa post ramp-up
In-situ Resource Development Upside:
Combined Tailings & In-situ Operations:
Next Steps:
decision to mine
following the decision to mine
ASX: NCZ
Century Exploration Potential –Millennium Target
26
Targeting extensions of the original ore body to the north
Potential displaced portion
Termite Range Fault Nikkis Fault Interpreted formation of
Orebody structure prior to mining
Mining Lease Program
the
Big Zinc
mining operations (right)
a conceptual target slumping location of the missing section (denoted by a yellow star)
crater floor contours (left) and topographic map (right)
results over the next quarter is anticipated to generate further targets with potential for dislocated Century blocks
underway
ASX: NCZ
SummaryNew Century Value Proposition
27
Significant operational derisking since concentrate production began in September 2018 Zinc Production: None Zinc Production: >90,000t metal to date Perceived Risks
? Ability to develop Australia’s largest hydraulic mining ops ? Tailings deposit too fine to float ? Zinc concentrate slurry pipeline blocked and unusable for future
? Produced zinc concentrate unsalable to existing global smelter base ? Long term sustainable grid power ? Human resourcing for operational readiness ? Short mine life (only to 2024) ? Ability to attract board talent with strong project execution and
Deliverables
Hydraulic mining ops developed & continuing ramp up Results averaging 52% recovery in September 2019 >185,000t zinc concentrate to date produced & transported through the Century logistics infrastructure 100% of production sold, 17 shipments to 7 smelters across three continents Long term power and gas supply secured Competent operational team established Mine life potential extended to 2026 Evolving board with highly credentialed independent new additions (Rob McDonald, Peter Watson & Nick Cernotta)
New Century is focused on completing its ramp up to 12Mtpa over FY20 and positioning itself to benefit from a tightening zinc market
OCTOBER 2019 SEPTEMBER 2018
ASX: NCZ
JORC2012 Compliant Reserves & Resources Statement
28
Competent Person Statement & ZnEq Calculation ZnEq was calculated for each block of the Century Tailings Deposit from the estimated block grades. The ZnEq calculation takes into account, recoveries, payability (including transport and refining charges) and metal prices in generating a zinc equivalent value for each block grade for Ag and Zn. ZnEq = Zn%+ + Ag troy oz/t*0.002573. Metal prices used in the calculation are: Zn US$3,000/t, and Ag US$17.50/troy oz. The information in this announcement that relates to the Mineral Resources estimate on the Silver King Deposit and the East Fault Block Deposit was first reported by the Company in its prospectus released to ASX on 20 June 2017, and the South Block Deposit was first reported by the Company to the ASX on 15 January 2018. The Company confirms that it is not aware of any new information or data that materially affects the information included in the original market announcements and that all material assumptions and technical parameters underpinning the Mineral Resources estimates in the relevant original market announcements continue to apply and have not materially changed. The information in this announcement that relates to the Ore Reserve estimate at the Century Tailings Deposit was first reported by the Company in its ASX announcement titled "New Century Reports Outstanding Feasibility Results that Confirm a Highly Profitable, Large Scale Production and Low Cost Operation for the Century Mine Restart" dated 28 November 2017. The Company confirms that it is not aware of any new information or data that materially affects the information included in the original market announcement and that all material assumptions and technical parameters underpinning the estimates in the original market announcement continue to apply and have not materially changed.
Mineral Resources Tonnes (Mt) Grade Contained Metal
Zinc (%) Lead (%) Silver (g/t) Zinc (t) Lead (t) Silver (oz) South Block (Indicated) 6.1 5.3 1.5 43 322,000 90,000 8,550,000 Silver King (Inferred) 2.7 6.9 12.5 120 186,000 337,500 10,500,000 East Fault Block (Indicated) 0.6 9.8 1.1 42 63,000 7,300 872,000
Total Mineral Resources 9.4 6.1 4.6 65 571,000 433,800 19,922,000 Ore Reserves Tonnes (Mt) Grade Contained Metal
ZnEq (%) Zinc (%) Silver (g/t) Zinc (t) Lead (t) Silver (oz)
Century Tailings
(Proved Ore Reserve)
77.3 3.1 3.0 12 2,287,662
New Century Resources Limited
Level 4, 360 Collins Street, Melbourne VIC 3000 +61 (3) 9070 3300 www.newcenturyresources.com
Contact
Patrick Walta
Managing Director info@newcenturyresources.com