
SLIDE 1
Debt Investor Presentation
October 2010
!"#$%&'" (!!
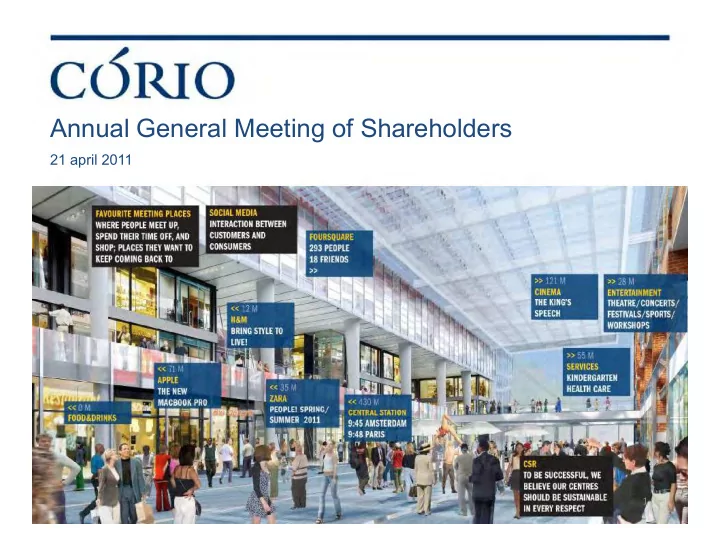
Annual General Meeting of Shareholders
21 april 2011
!
Annual General Meeting of Shareholders Debt Investor Presentation - - PowerPoint PPT Presentation
Annual General Meeting of Shareholders Debt Investor Presentation 21 april 2011 October 2010 !"#$%&'" (!! ! 10 year Corio 63%+C3'&3" 5E<%* I7 (((J 5<'*"3C"1D+=E" 5E<%* &))D* 5E<%*
!"#$%&'" (!!
!
VIB #))*+ ,-+ .*/+*%",-+ 0*++&/- 1*2*'3$,*/+ WBN Italy Turkey Oevelopment Corio
4566 7 8!9", 5::. %*-&,*" ;%</=* >*23'2&/-" .%*?&+";<=&'&+@ 7 A((", 4566 7 B (", 5<'*"3C"1D+=E" FCC&=*)"</?" &/?D)+%&<' 5E<%* &))D* 7 GH"," 63%+C3'&3" I7 (((J 5E<%* 5E<%* &))D* 7 A((",
Germany
AGM 2011 21 April 2011 2
AGM 2011 21 April 2011 3
31 December 2000 € 2.7 billion, 31 December 2010 € 7.2 billion
AGM 2011 4 21 April 2011
5
5
Geographic and sector spread in value
AGM 2011 21 April 2011
AGM 2011 21 April 2011 6
AGM 2011 7
Schlossstrass e (Berlin) Arneken Galerie (Hildesheim) Königsgalerie (Duisburg) Forum Duisburg (Duisburg) Development Projects Operational shopping centres Centrum Galerie Dresden (Dresden) Quartier an der Stadtmauer (Bamberg)
21 April 2011
AGM 2011 8 21 April 2011
AGM 2011 9 21 April 2011
AGM 2011 10 21 April 2011
Other 1 % Benelux 1 0% Italy 4% France 34% Nordics 1 1 % UK 1 5% Germany 1 8% Switzerland 7%
AGM 2011 11
Asset Managers 80% Insurance 6% Other 3% Pension funds 6% Private banking 4% Banks 1 %
21 April 2011
AGM 2011 21 April 2011
12
AGM 2011 21 April 2011 13
AGM 2011
21 April 2011 14
!"#"$ %&'"$()!* +!"$,- ./" 0,&2,3 +4 %&"$(#5$* 6&(.'/#*
!!K! KA AB L<%<M"N*%)=EO< M"5+%<?&2<%&D)M"6D''"P"N*<%M" Q<))&,3"1D+& !(K( KR ( Q<O%3M"Q*+%3M"Q*?&<,<%O+M"5<+D%/ BKR K! G #SM"T+3)M"U<''PU<'' HKR !KB SPQ AK8 !KG ! .5. .3,$D+*%"5=&*/=* GK8 !K GB N'3OO*%M Q<%)O%<,*%M"V*/3)M"N<%+"5,&+ GK! !K !( .<%%*C3D%M".E<,$&3/M"Q<%=EW 6'D)M"UN GK( !K! !! ;Y#.M".3/C3%<,< RK! (K9 Z<%)+<?+ KB (K9 G .*'&3M"[*//@C*%M 0<D%*/+M".*%%*% &$#/ 7787 9:8; <=9
21 April 2011 AGM 2011 15
16 21 April 2011 AGM 2011 16
17 21 April 2011 AGM 2011 17
18 21 April 2011 AGM 2011 18
21 April 2011 19 AGM 2011
G(]"3C"3D%"=*/+%*)
=*/+%*",</<-*%)
4/&2*%)&+*&+
;%</=*M"%*)D'+&/-"&/"R(("<=+D<'" `3\)"C3%"&/E<\&+</+)"3C"+E*" =<+=E,*/+"<%*<
*,$'3@**
$<%+&=&$<+*?"&/"<")<+&)C<=+&3/" )+D?@
.F c, 3/"<"'&O*aC3%a'&O*" \<)&)" ((Ba (!(
+*/</+)".Y0
?*2*'3$,*/+"C3%e<%)D
;3%D,"1D&)\D%- >'*$#)"#?)/)$@,)",&'(,&A!(#$)&"* %(!#$)"B,*'*$#)"#?/!,5!"$(!* C'$$)"B,5&"*'.!(*,2)(*$ +&&$!D,)",*&5)!$@ E!#D!(*F)A,)",&'(,5'/$'(!
21 April 2011 20 AGM 2011
21 April 2011 21 AGM 2011
AGM 2011 21 April 2011 22
23 AGM 2011 (€ m) 31-12-10 31-12-09 Nr of contracts
21 April 2011
AGM 2011 21 April 2011 24
(total pipeline 31 Dec 2010 € 3.0 bln, 31 Dec 2009 € 2.3 bln)
AGM 2011 25 (€ m) Committed Deferrable Waivable Total Already paid 237.9 137.7 3.8 379.4 Fixed 944.2 57.6 1,001.8 Variable 1,111.5 545.5 1,657.0 Total 1,182.1 1,306.8 549.3 3,038.2 % of total 39% 43% 18% 100% (Net Initial Yield in %) Committed Deferrable Waivable Fixed 6.6 7.2 Variable 7.6 6.4 21 April 2011
AGM 2011
21 April 2011 26
AGM 2011
21 April 2011 27
AGM 2011
21 April 2011 28
AGM 2011 21 April 2011 29
AGM 2011 30 21 April 2011
AGM 2011 31 21 April 2011
AGM 2011 32
Value (€ m) Turnover based Retail (€ m) 2010 2009 Retail 6,954 rent 1.3% Like-for-like 297.4 291.8 1.9% Offices/Ind 281 Non standing 63.0 12.8 NR Total 7,235 Retail 31-12-10 31-12-09 Total 360.4 304.6 18.3% NTY 6.5% 6.6% Offices (€ m) 2010 2009 Like-for-like 22.1 23.5
Non standing 1.1 4.7 NR Total 23.2 28.2
Industrial (€ m) 2010 2009 Like-for-like 2.5 3.0
Non standing 0.8 1.1 NR Revaluations € m % Total 3.3 4.1
Retail 162.1 2.5 Offices 14.5 5.7 Total (€ m) 2010 2009 Industrial 3.4 32.0 Like-for-like 322.0 318.4 1.1% Total 180.0 2.6 Non standing 64.9 18.6 NR Total 386.9 337.0 14.8% Occupancy 2010 2009 Retail 96.2% 96.3% Retail % Offices 95.8% 96.6% Relettings 2.6% Industrial 80.1% 84.6% Renewals 5.0% Total 96.1% 96.2% Total 3.8% % of total 5.0 4.8 9.8
96% 4%
Portfolio distribution
Retail Offices/Ind
21 April 2011
33
AGM 2011 21 April 2011
AGM 2011 34
(€ m) 2010 2009 Gross rental income 451.6 390.9 Property operating expenses
Net rental income 386.8 337.0 Administrative expenses
Operating income 347.3 301.5 Share of profit of equity accounted investees (direct) 7.8 8.7 EBIT 355.1 310.2 Net finance expenses
Corporate income tax
3.5 Direct result 252.9 218.8 Non-controlling interest (direct) 1.9 0.6 Direct result (excluding non-controlling) 251.0 218.2 Net revaluation on investment properties 173.4
Result on sales of investment properties 6.6
Share of result of equity accounted investees (indirect)
Impairment of goodwill
Deferred tax expenses
58.0 Net other income/expenses
Indirect result 118.8
Non-controlling interest (indirect)
Indirect result (excluding non-controlling interest) 124.7
Total result (excluding non-controlling) 375.7
21 April 2011
AGM 2011 35 21 April 2011
€ m Nether- lands France Italy Spain/ Portugal Germany Turkey Total Total (%) Retail 50.7 85.6 37.7 16.3 3.6
175.9 2.8 Offices
12.4 1.3 10.3 4.4 Industrial 3.4 3.4 34.7 Total 47.4 101.4 37.7 16.3 4.9
189.6 2.9 Total (%) 2.6 5.9 2.8 2.2 0.9
2.9 Development
9.3
Development (%)
12.8
Total revaluation 42.8 110.7 32.5 15.9 4.9
180.0 2.6 Total revaluation (%) 2.2 6.2 2.3 2.2 0.8
2.6
36
AGM 2011
* Based on value of property excluding purchasers’ cost
21 April 2011
Disclaimer for future-oriented information This presentation contains future-oriented information concerning the financial position, plans and objectives, activities and market conditions in which the company operates. By their nature, future-oriented statements and forecasts contain risks and uncertainty, since they concern events and circumstances, which may or may not occur in the future. The actual results and developments may deviate from the expectations, due to factors such as: general economic circumstances, the results of the financial markets, changes in interest and currency levels, changes in legislation and regulations and in the policy of governments or regulatory authorities. Historic results offer no guarantee of future performance.
For more information: Ingrid Prins Investor Relations Manager +31 (0)30 2346743 ingrid.prins@nl.corio-eu.com You can follow us on Twitter: @CorioIR Corio app for iPad now available in App store
AGM 2011 21 April 2011 37
AGM 2011 21 April 2011 38