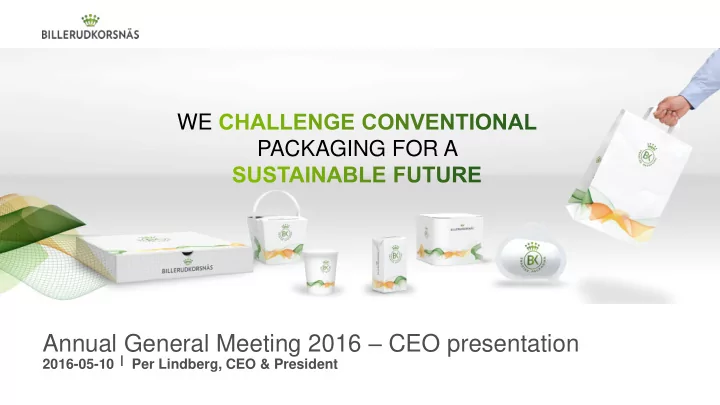

WE PACKAGING FOR A Annual General Meeting 2016 – CEO presentation 2016-05-10 Per Lindberg, CEO & President
2015 2
2015 – A VERY GOOD YEAR We reached all financial targets Several production and delivery records Production records in Gruvön, Gävle, Skärblacka, Karlsborg Continued innovation for sustainable solutions 3
2015 – BILLERUDKORSNÄS IN NUMBERS Target 2015 2014 Net sales, SEKm 24 000 (2018) 21 814 20 853 Operating profit, SEKm n/a 2 586 1 901 Operating margin > 10% 12% 9% Return on capital employed,%* > 13% 15% 11% Operating cash flow, SEKm n/a 1 957 1 739 Net debt/equity ratio < 0,9 0,40 0,67 Dividend 50% of net profit 4.25 (49%)** 3.15 (51%) 4 **Board’s proposal *Based on rolling 12 months
NEW FINANCIAL TARGETS FOR PROFITABLE GROWTH Organic growth EBITDA margin 3-4% per year >17% 2015: 5% 2015: 18% Return on Net debt/EBITDA capital employed < 2,5 >13% 2015: 1.2 2015: 15% Dividend policy: 50% of net profit 2015: 49%* 5 *Board’s proposal
BUSINESS AREAS IN SHORT SHARE OF GROUP NET SALES SHARE OF GROUP OPERATING PROFIT CORRUGATED SOLUTIONS PACKAGING PAPER PACKAGING PAPER CORRUGATED SOLUTIONS 15% 39% 38% 21% SEKm 3 300 SEKm 8 600 SEKm 970 SEKm 550 CONSUMER BOARD 37% CONSUMER BOARD 37% SEKm 8 000 SEKm 950 Only numbers for Business Areas, the total does not add up to 100% 6
MARKET SEGMENTS & REGIONS IN SHORT NET SALES BY MARKET SEGMENT NET SALES PER REGION 73% Europe 2% 17% 2% 17% Food & Beverages, 59% Middle East Asia Industrial, 26% 4% 3% Consumer & Luxury Goods, 9% Africa South Medical & Hygiene, 6% America 1% Other regions 7
OPERATING PROFIT* PER QUARTER SEKm 800 698 683 700 555 600 542 518 467 460 500 438 400 337 324 321 300 232 200 100 0 Q 1 Q 2 Q 3 Q 4 Q 1 Q 2 Q 3 Q 4 Q 1 Q 2 Q 3 Q 4 2013 2014 2015 *Excluding non recurring items 8
WHAT HAPPENED IN Q4 2015? SEKm -156 Planned maintenance costs in quarter -154 Rebuild related costs and start-up delays -95 Additional unexpected maintenance costs and production losses Total impact on quarterly results -405 Approximate impact per business area SEKm -142 Packaging Paper -238 Consumer Board -25 Corrugated Solutions -405 9
DECIDED ACTIONS 2016 final rebuild stage of KM5 in Frövi postponed Investments for 2016 estimated to SEK 1 300 million, excluding future restructuring projects in Gruvön and Skärblacka. Focus on stability and cost efficiency in production 10
TOTAL PRODUCTION OUTPUT IMPROVING 97% Outcome vs. ramp-up plan during Q1 16 110% 100% 90% 80% Production output Ramp-up plan Linear trend 70% Nov 15 Dec 15 Jan 16 Feb 16 Mar 16 Oct 15 11
PRODUCTION PROBLEMS AFFECT SHARE PRICE BillerudKorsnäs 170 Stockholm stock exchange (OMXSPI) 160 150 140 130 120 110 100 2015 2016 12
OUR CASH FLOW USES Reduce debt Dividend to shareholders Development investments Bank Acquisitions Share- hol- ders R&D M&A
FUTURE – 3 PHASES 14
PHASE 1 – ESTABLISHED A STRONG COMPANY Packaging focused company Capacity for investments Broader product portfolio Capacity for innovation Synergies Sustainability part of core business 15
PHASE 1 – ESTABLISHED A STRONG BRAND
WE HAVE INVESTED SEK 2 BILLION SINCE 2012 TO INCREASE CAPACITY AND QUALITY LEAD PACKAGING PAPER CONSUMER BOARD CORRUGATED SOLUTIONS 260 SEKm 1600 SEKm 180 MSEK Brown sack paper Liquid Packaging Board S/C fluting Cartonboard + 260 thousand tonnes 17
PHASE 2 – WE ARE PLANNING TO INVEST MORE THAN SEK 5 BILLION… 5 Moving MG paper machine from Tervasaari to Skärblacka 5 Building a new board machine at Gruvön production unit Optimisation of capacity within whole production system Investment rationale is to improve profitability and secure 4 organic growth 3 1 In accordance with Business Areas’ growth strategies 5 2 Improved EBITDA >1000 MSEK when fully implemented Continued organic growth with 3-4% per year 18
…DURING NEXT THREE YEARS Possible production Possible production start on board start on MG machine machine in Gruvön* in Skärblacka* Decision on new board machine in Gruvön Feasibility Decision on moving studies Tervasaari machine started Q3 Q2 Q4 2018 2019 2015 2016 2016 19 *Subject to feasibility study results
PHASE 3 – M&A MAY BOOST LONG TERM GROWTH We have the financial capacity We have proven experience in merging businesses and quickly extracting synergies Bolt-on acquisitions with synergy potentials are currently the most interesting candidates Right valuation and availability are prerequisites for larger acquisitions 20
PHASE 3 – INVESTING IN INNOVATION – ON THREE LEVELS 2015 2015 vs 2013: 2x # employees Challenger products 5x # projects 180 % increased spend Innovation agenda 2013 R&D and product R&D and product development development 21
PHASE 3 – SUSTAINABILITY – A BUSINESS OPPORTUNITY MAXIMIZING POSITIVE IMPACT A SUSTAINABLE AND INCREASED BIO-BASED CUSTOMER VALUE SOCIETY RESPONSIBLE VALUE CHAIN MINIMIZING NEGATIVE IMPACT 22
WE PROVIDE SUSTAINABLE ALTERNATIVES Through our products… … and through our actions Environmental impact paper vs plastic 1 50-70 % lower CO 2 ADVANCED LEVEL 1 Life cycle assessment, Comparative study of virgin fibre based packaging products with competing plastic materials. IVL, 2015. 23
24
Recommend
More recommend