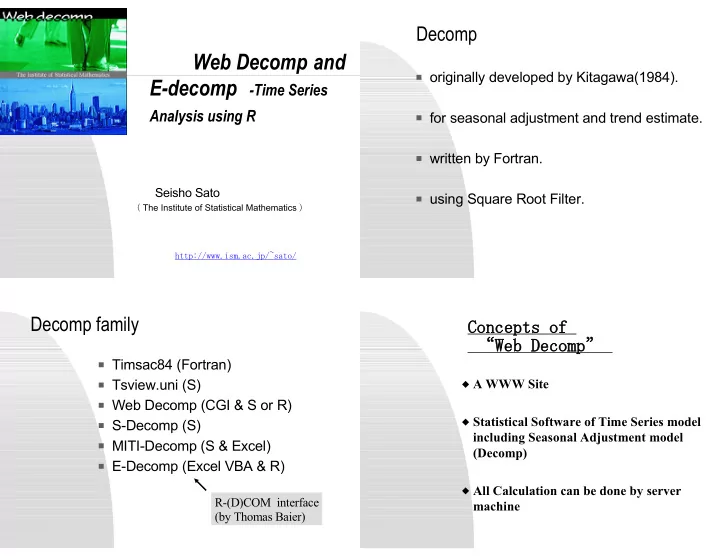

Decomp Web Decomp and ■ originally developed by Kitagawa(1984). E-decomp -Time Series Analysis using R ■ for seasonal adjustment and trend estimate. ■ written by Fortran. Seisho Sato ■ using Square Root Filter. ( The Institute of Statistical Mathematics ) http://www.ism.ac.jp/~sato/ Decomp family Concepts of “Web Decomp” ■ Timsac84 (Fortran) ■ Tsview.uni (S) ◆ A WWW Site ■ Web Decomp (CGI & S or R) ◆ Statistical Software of Time Series model ■ S-Decomp (S) including Seasonal Adjustment model ■ MITI-Decomp (S & Excel) (Decomp) ■ E-Decomp (Excel VBA & R) ◆ All Calculation can be done by server R-(D)COM interface machine (by Thomas Baier)
Menu of “Web Decomp” Fig 1. System of Web Decomp HTML Documents Decomp ―――― ■ History of Analysis Client Computer (PC, MAC, Workstation) State space modeling of seasonal adjustment WWW Browser Simple Calculation (Netscape Navigator by using JavaScript (Kitagwa and Gersh 1984) or Internet Explore) plot ―――― ■ Time series plot The Internet autocor ――― ■ R eci eve Send R esul t Data Plot of autocorrelation (TIMSAC72) spectrum ――― ■ Server Machine (ISM) Non-parametric spectrum (TIMSAC72) ARfit ―――― WWW Server ■ Fitting AR model (TIMSAC72) CGI Program (Interface for Web Decomp) ARMAfit ―――― ■ R or S S Language (Graphics) Fitting ARMA model ( Kitagawa(1993) ) log ―――― ■ Fortran Program (Numerical Calculation) Log-transformation Windows of Web Decomp Menu of “Web Decomp” ◆ diff ―――― First difference ◆ diff4 ―――― Seasonal difference for quarterly data ◆ diff12 ―――― Seasonal difference for monthly data ◆ Volatility ―――― Fitting Stochastic Volatility model (More methods will be added)
access numbers of Web Decomp access num ber ( m onthl y) 1800 1600 1400 1200 1000 access num ber 800 600 400 200 0 Dec-04 Jan-05 Feb-05 M ar-05 Apr-05 M ay-05 Jun-05 -05 Aug-05 Sep-05 O ct-05 Nov-05 Dec-05 Jan-06 Feb-06 M ar-06 Jul Total = 18871 About Decomp Parameter of Decomp ■ State Space Model Log transform: Δ d T(t) = e1(t) S(t) = -S(t-1) - … -S(t-p) + e2(t) Seasonal frequency: A(t) = a1 A(t-1) + … + aq A(t-q) + e3(t) Trend Order: y(t) = T(t) + S(t) + A(t) + TD(t) + e4(t) AR Order: T: Trend Trading Day Effects: S: Seasonal A: AR (Cyclical component) TD: Trading day y: Observation e1-e4: i.i.d noise
Summary of access list Output (Jun. 1997 - Jan. 1998) *. AC. JP ( Japanese Educat i on) 1414 *. O R. JP ( Pr ovi der et c. ) 786 ■ Graph output *. NE. JP ( Pr ovi der , O CN et c) 759 *. CO . JP ( Japanese com pany) 726 *. CO M ( US com pany) 284 ■ Data output *. GO . JP ( Japanese gover m ent ) 171 *. AD. JP ( Pr ovi der , M esh et c) 152 *. NET ( US) 66 *. EDU ( US Educat i on) 53 ■ Value of parameter and other *. TW ( Tai wan) 23 statistics *. HR ( Cr oat i a) 17 *. DE ( Ger m any) 17 *. UK, *. GB ( UK) 14 *. TO KYO . JP ( Tokyo M et r o) 14 ( unknown) 1439 E-Decomp E-Decomp EXCEL VBA R-(D)COM R DLL
Recommend
More recommend