SLIDE 1
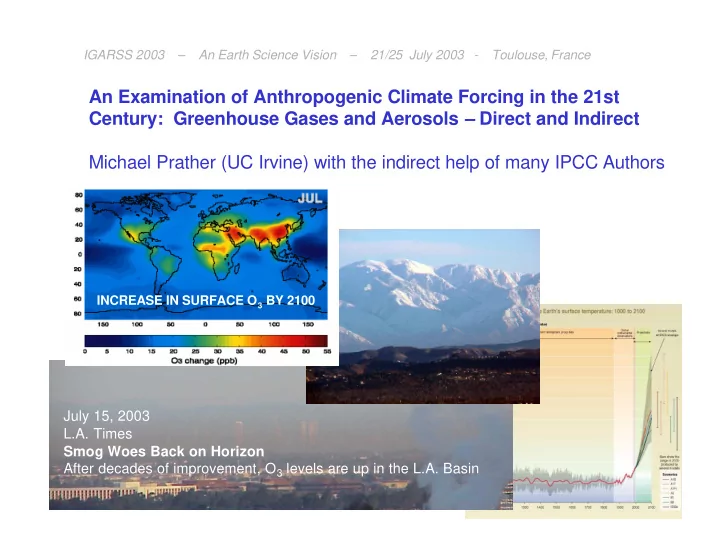
An Examination of Anthropogenic Climate Forcing in the 21st Century: Greenhouse Gases and Aerosols – Direct and Indirect Michael Prather (UC Irvine) with the indirect help of many IPCC Authors
IGARSS 2003 – An Earth Science Vision – 21/25 July 2003 - Toulouse, France INCREASE IN SURFACE O3 BY 2100
July 15, 2003 L.A. Times Smog Woes Back on Horizon After decades of improvement, O3 levels are up in the L.A. Basin
SLIDE 2 An Examination of Anthropogenic Climate Forcing in the 21st Century: Greenhouse Gases and Aerosols – Direct and Indirect Michael Prather (UC Irvine) with the indirect help of many IPCC Authors
IGARSS 2003 – An Earth Science Vision – 21/25 July 2003 - Toulouse, France
What is forcing the climate? Attribution - Why do we care? How do indirect effects work?
within atmospheric chemistry across the Earth system
21st century scenarios
SRES under attack? What is needed?
How can satellite observations help? Feedbacks and cross-linkages
Global Air Quality
SLIDE 3
SLIDE 4 Figure 5. Climate forcing in the past 50 years due to six mechanisms (GHGs = long-lived greenhouse gases). The tropospheric aerosol forcing is very uncertain [Reference 1b].
- J. Hansen et al., JGR, 107, D18, 4347, 2002
SLIDE 5 Attribution of Climate Change: Certainty
the historical approach
- Sen. Gore sub-committee hearings 1988:
I am 99 per cent certain that we are now seeing global warming ....
James Hansen
SLIDE 6
Attribution of Climate Change: Cause
the IPCC SAR/TAR approach
IPCC WG1 Second Assessment Report 1996:
The balance of evidence suggests that there is a discernible human influence on global climate.
IPCC Third Assessment Report 2001:
The Earth’s climate system has demonstrably changed on both global and regional scales since the pre-industrial era, with some of these changes attributable to human activities. There is new and stronger evidence that most of the warming observed over the last 50 years is attributable to human activities.
SLIDE 7
Attribution of Climate Change: Blame
the UN FCCC Brazil Proposal
During the negotiations of the Kyoto Protocol in 1997, the delegation of Brazil made a proposal for distributing the burden of emission reductions among Parties included in Annex I to the [Framework] Convention. Reductions towards an overall emission ceiling ... Among individual Annex I Parties proportional to their relative share of responsibility for climate change. SBSTA (2002) noted that, for the purpose of validating the models against observed climate, the analysis should also include factors influencing global climate other than the greenhouse gases covered by the Convention and the Kyoto Protocol. Thus we need national inventories for Kyoto and non-Kyoto greenhouse agents.
SLIDE 8
Attribution of Climate Change: Avoidance
Belshazzar’s Feast by Rembrandt
SLIDE 9
Climate Change involves the entire Earth system including ecosystems and human dimensions This talk focuses on Atmospheric Composition
SLIDE 10
CH4
How do non-greenhouse Pollutants impact Climate ? CO, VOC, NOX (=NO+NO2), & CH4 control Tropospheric Chemistry is the sink for CH4 & HFCs; the source for O3
OH HO2 NO VOC CO HFC O3 CH4
SLIDE 11
CH4 OH CO O3
SLIDE 12
CH4
CO becomes an indirect greenhouse gas CO emissions are effectively equivalent to CH4 emissions: 100 Tg-CO = 5 Tg-CH4
(IPCC, TAR)
OH CO O3
SLIDE 13
Climate Change involves the entire Earth system including ecosystems and human dimensions What about feedbacks on composition?
SLIDE 14
SLIDE 15
Climate Change involves the entire Earth system including ecosystems and human dimensions How much detail is needed for emissions?
SLIDE 16
CH4 OH NOX O3 O3
SLIDE 17
SLIDE 18
NOx becomes an indirect greenhouse gas
0.5 Tg-N of NOx short-lived trop-O3 increase (warming)
long-lived CH4 & O3 decrease (cooling) depends strongly on location of emissions
SLIDE 19
IPCC (2001) notes geographic shift in NOx emissions for SRES scenarios
SLIDE 20 EDGAR-HYDE 1.3: HISTORICAL ANTHROPOGENIC EMISSIONS 1890-1990 This dataset comprises global anthropogenic emissions of CO2, CH4, N2O, CO, NOx, NMVOC, SO2 and NH3 for the period 1890 to 1990. With time steps of 10 year emissions have been made available both on an 1x1 degree grid (total of all sources) as well as for each of the 13 EDGAR 2.0 regions. If you use this dataset, please cite the dataset as mentioned below. After completion of this dataset, EDGAR 3.2 data for 1990-1995 (1970-1995 for direct greenhouse gases) have become available with updated emissions and expanded source categories. To take account of these revised estimates for recent years, the original EDGAR-HYDE 1.3 dataset should be adjusted to the new EDGAR estimates for 1970 onwards: EDGAR-HYDE 1.4: Adjusted Regional Historical Emissions 1890-1990 . Reference: Van Aardenne, J.A., Dentener, F.J., Olivier, J.G.J., Klein Goldewijk, C.G.M. and J. Lelieveld (2001) A 1 x 1 degree resolution dataset of historical anthropogenic trace gas emissions for the period 1890-1990. Global Biogeochemical Cycles,15(4), 909-928. Datasets
- Regional emissions for every 10 year are provided for ten source categories.
- Gridded emission inventories compiled for total anthropogenic emissions for every 10 year.
SLIDE 21
Parties to the UN FCCC are required to report National Greenhouse Gas Inventories
SLIDE 22 CONFERENCE OF THE PARTIES Eighth session New Delhi, 23 October – 1 November 2002
Estimates of emissions and removals
- 18. Article 12.1(a) of the Convention requires that each Party shall communicate
to the COP, through the secretariat, inter alia, a national inventory of anthropogenic emissions by sources and removals by sinks of all greenhouse gases not controlled by the Montreal Protocol. As a minimum requirement, inventories shall contain information on the following greenhouse gases: carbon dioxide (CO2), methane (CH4), nitrous oxide (N2O), perfluorocarbons (PFCs), hydrofluorocarbons (HFCs) and sulphur hexafluoride (SF6). Annex I Parties should report anthropogenic emissions and removals of any other greenhouse gases whose 100-year global warming potential (GWP) values have been identified by the IPCC and adopted by the COP. Annex I Parties should also provide information on the following indirect greenhouse gases: carbon monoxide (CO), nitrogen
- xides (NOx) and non-methane volatile organic compounds (NMVOCs), as
well as sulphur oxides (SOx). Table 4.D - Agriculture
Fraction of synthetic fertilizer N applied to soils that volatilizes as NH3 and NOx Fraction of livestock N excretion that volatilizes as NH3 and NOx
SLIDE 23
SLIDE 24
United Nations Economic Commission for Europe – data source
SLIDE 25
What Greenhouse Agents are listed under Kyoto ?
Annex A Carbon dioxide (CO2) Methane (CH4) Nitrous oxide (N2O) Hydrofluorocarbons (HFCs) Perfluorocarbons (PFCs) Sulfur hexafluoride (SF6)
What are also included in the NGGI reporting req’s ?
National Inventory for Annex I Parties Sulfur dioxide (SO2) Carbon monoxide (CO) Nitrogen Oxides (NOX) Non-methane VOC ?Ammonia (NH3)
SLIDE 26
What Anthropogenic Greenhouse Agents are forgotten by the UNFCCC ?
CFCs & HCFCs (Montreal - OK) Black Carbon Organic Carbon Aerosols Dust
SLIDE 27
Which Greenhouse Agents have a good historical record ? CO2 CH4 N2O CFCs solar strat O3 ⌧ trop O3 sulfate ⌧ fossil fuel OC/BC ⌧ biomass OC/BC ⌧ mineral dust ⌧ aerosol indirect ⌧ land use /albedo Which Greenhouse Agents are attributable ?
SLIDE 28
Climate Change involves the entire Earth system including ecosystems and human dimensions The 21st Century - Where does the SRES come from?
SLIDE 29
IPCC SRES Scenarios for the TAR
SLIDE 30
SLIDE 31
CH4 N2O
SLIDE 32
SLIDE 33
HFC-134a CF4
SLIDE 34
tropospheric O3 lifetime of CH4
SLIDE 35
SLIDE 36 (Vol.14, No 2 & 3, 2003, pp.187-214)
IPCC SRES under attack from the political side
SLIDE 37 Figure 14. CO2 in IPCC (2001), “alternative” and “2° C”
- scenarios. In the alternative scenario ∆CO2 decreases linearly
from 1.7 ppm/year in 2000 to 1.3 ppm/year in 2050 and then linearly to zero in 2100; CO2 peaks at ~475 ppm in 2100. In the “2°C” scenario ∆CO2 increases linearly from 1.7 ppm/year in 2000 to 3 ppm/yr in 2050 and then decreases linearly to zero in 2100; CO2 peaks at ~560 ppm in 2100. Upper and lower limits of IPCC range are their scenarios A1FI and B1 [IPCC, 2001, Appendix II, p. 807 and Figure 18, p.65].
The “alternative” scenario is an extension of the scenario we defined for 2000-2050 (reference 6), with the annual CO2 growth decreasing linearly to zero between 2050 and 2100 such that atmospheric CO2 stops growing by 2100. Such an assumption, which is required for any scenario that achieves stabilization, implies at least a 50% reduction in fossil fuel use or CO2 capture and sequestration. J.E. Hansen et al., 2003
IPCC SRES under attack from the science side
SLIDE 38 Satellite Observations can provide the necessary global validation
SLIDE 39
SLIDE 40
SLIDE 41 Orbiting Carbon Observatory
JPL
The Orbiting Carbon Observatory ( OCO) provides space - based observations of atm ospheric carbon dioxide ( CO2) , the principal anthropogenic driver of clim ate
- change. This m ission uses m ature technologies to address NASA's highest
priority carbon cycle m easurem ent requirem ent. OCO generates the know ledge needed to im prove projections of future atm ospheric CO2.
- Make the first, global, space-based observations of the column integrated CO2 dry air
mole fraction, XCO2
- Provide independent data validation approaches to ensure high accuracy (1 ppm, 0.3% )
simulated column-mean CO2
SLIDE 42
TES
– tropospheric O3, CH4, CO, HNO3, NO, NO2,
MLS
– upper trop / strat
HIRDLS
– upper trop / strat
OMI
– O3
SLIDE 43
Monitoring surface NO emissions: Global Inventory of Nitrogen Oxide Emissions Constrained by Space-based (GOME) Observations of NO2 Columns, R.V. Martin et al., JGR, 2003.
SLIDE 44
Feedbacks and Cross-Linkages
from Global Air Quality to an H2 economy
SLIDE 45 IPCC (2001). “Changes projected in the SRES A2 and A1FI scenarios would degrade air quality over much of the globe by increasing background levels of O3. In northern mid-latitudes during summer, the zonal average increases near the surface are about 30 ppb or more, raising back- ground levels to nearly 80 ppb, threatening attainment of air quality standards over most metropolitan and even rural regions, and compromising crop and forest
- productivity. This problem reaches across
continental boundaries since emissions of NOx influence photochemistry on a hemispheric scale.”
INCREASE IN SURFACE O3 BY 2100
SLIDE 46 "A simple chemical reaction between hydrogen and oxygen generates energy, which can be used to power a car producing only water, not exhaust fumes. With a new national commitment, our scientists and engineers will overcome
- bstacles to taking these cars from laboratory to showroom so that the first car
driven by a child born today could be powered by hydrogen, and pollution-free. Join me in this important innovation to make our air significantly cleaner, and our country much less dependent on foreign sources of energy.“ — President Bush, State of the Union Address, January 28, 2003
SLIDE 47
The aura of a clean, hydrogen (H2)-fueled future ? N2O, a greenhouse gas
SLIDE 48
CLIMATE IMPLICATIONS OF A HYDROGEN ECONOMY Dick Derwent, Climate Research, The U.K. Met Office 2002
SLIDE 49
CH4 OH H2 O3 H2 ?
SLIDE 50 H2 is a greenhouse gas by virtue of its tropospheric chemistry and its
role in changing the build-up of methane and ozone
the global warming consequences of the global hydrogen economy
will depend on the leakage rates for hydrogen manufacture, storage and distribution systems
IPCC Working Group I report recognised that a future H2 economy
would act as a potential climate perturbation
sustained H2 increases of +1800 ppb require 315 Tg-H2/yr, but yield
45 Tg-CH4/yr, which on a GWP basis is much larger than all of aviation’s CO2 emissions. CLIMATE IMPLICATIONS OF A HYDROGEN ECONOMY Dick Derwent & Michael Prather
SLIDE 51
STRATOSPHERIC IMPLICATIONS OF A HYDROGEN ECONOMY
SLIDE 52 Climate change involves the entire Earth system: Indirect effects / feedbacks on composition and climate forcing involve the physical climate system, natural and managed ecosystems, socio-economic development, on a global scale
- - NOT just anthropogenic emissions.
SLIDE 53