
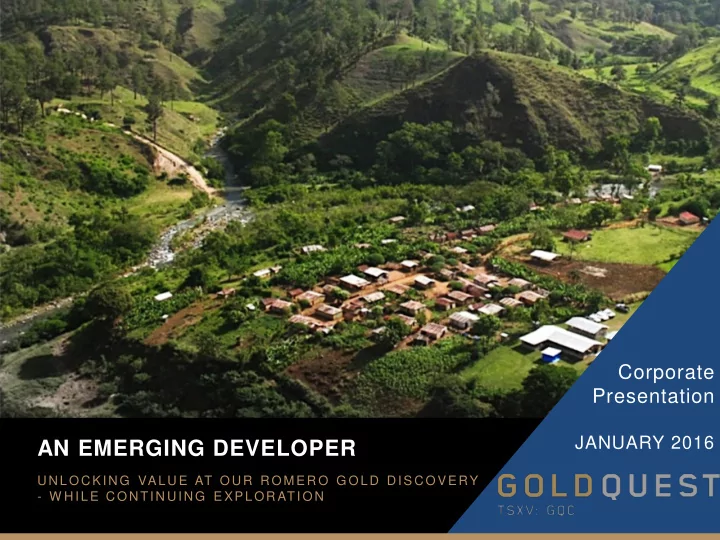
SLIDE 1
Corporate Presentation
JANUARY 2016
AN EMERGING DEVELOPER
UNLOCKING VALUE AT OUR ROMERO GOLD DISCOVERY
- W HILE CONTINUING EXPLORATI ON
AN EMERGING DEVELOPER UNLOCKING VALUE AT OUR ROMERO GOLD DISCOVERY - - PowerPoint PPT Presentation
Corporate Presentation JANUARY 2016 AN EMERGING DEVELOPER UNLOCKING VALUE AT OUR ROMERO GOLD DISCOVERY - W HILE CONTINUING EXPLORATI ON Forward-Looking Statements Statements contained in this presentation that are not historical facts are
Corporate Presentation
JANUARY 2016
UNLOCKING VALUE AT OUR ROMERO GOLD DISCOVERY
GOLDQUEST MINING CORP. CORPORATE PRESENTATION
2
TSX-V:GQC | GOLDQUESTCORP.COM | JANUARY 2016
Statements contained in this presentation that are not historical facts are forward-looking information that involves known and unknown risks and uncertainties. Forward-looking statements in this presentation include, but are not limited to, statements with respect to the preliminary economic assessment for the Romero Project (the “PEA”), the results of the PEA, interpretation of the results of the PEA, the merits of the Company's mineral properties, mineral resource estimates, the Dominican Republic and the Company's plans, exploration programs and studies for its mineral properties, including the timing of such plans, programs and studies. In certain cases, forward-looking statements can be identified by the use of words such as "plans", “proposed”, "has proven", "expects" or "does not expect", "is expected", “upside”, "potential", "appears", "budget", "scheduled", "estimates", "forecasts", “goal”, "at least", "intends", "anticipates" or "does not anticipate", or "believes", or variations of such words and phrases or state that certain actions, events or results "may", "could", "would", "should", "might" or "will be taken", "occur" or "be achieved". Forward-looking statements involve known and unknown risks, uncertainties and other factors which may cause the actual results, performance or achievements of the Company to be materially different from any future results, performance or achievements expressed or implied by the forward-looking statements. Such risks and other factors include, among others, risks related to uncertainties inherent in the preparation of preliminary economic assessments and the estimation of mineral resources; commodity prices; changes in general economic conditions; market sentiment; currency exchange rates; the Company's ability to continue as a going concern; the Company's ability to raise funds through equity financings; risks inherent in mineral exploration; risks related to operations in foreign countries; future prices of metals; failure of equipment or processes to operate as anticipated; accidents, labor disputes and other risks of the mining industry; delays in obtaining governmental approvals; government regulation of mining operations; environmental risks; title disputes or claims; limitations on insurance coverage and the timing and possible outcome of litigation. Although the Company has attempted to identify important factors that could affect the Company and may cause actual actions, events or results to differ materially from those described in forward-looking statements, there may be other factors that cause actions, events or results not to be as anticipated, estimated or intended. There can be no assurance that forward-looking statements will prove to be accurate, as actual results and future events could differ materially from those anticipated in such statements. Accordingly, do not place undue reliance on forward-looking statements. All statements are made as of the date of this presentation and the Company is under no obligation to update or alter any forward- looking statements. Forward-looking statements are based on assumptions that the Company believes to be reasonable, including expectations regarding mineral exploration and development costs; expected trends in mineral prices and currency exchange rates; the accuracy of the Company's current mineral resource estimates; that the Company's activities will be in accordance with the Company's public statements and stated goals; that there will be no material adverse change affecting the Company or its properties; that all required approvals will be obtained and that there will be no significant disruptions affecting the Company or its properties. Certain technical information in this presentation was taken from the technical report entitled “A Mineral Resource Estimate for the Romero Project, Tireo Property, Province of San Juan, Dominican Republic” dated December 13, 2013 (effective date of resource is October 29, 2013), prepared by B. Terrance Hennessey, P.Geo., Ing. Alan J. San Martin, MAusIMM (CP) and Richard M. Gowans, P.Eng. of Micon International Limited, and is subject to all of the assumptions, qualifications and procedures described therein. The PEA is preliminary in nature, includes inferred mineral resources that are considered too speculative geologically to have the economic considerations applied to them that would enable them to be categorized as mineral reserves, and there is no certainty that the PEA will be realized. Mineral resources that are not mineral reserves do not have demonstrated economic viability. There is no certainty that the mineral resources will be categorized as mineral reserves. The technical information in this presentation related to the PEA is based on information prepared by Mr. Makarenko, P.Eng. and Ms. McLeod, P.Eng. of JDS Energy & Mining
Jeremy K. Niemi, P.Geo., VP Exploration of the Company, is the Qualified Person who supervised the preparation of the technical information related to exploration in this presentation. Please refer to the Company's most recent Management's Discussion & Analysis (available at www.sedar.com) for further information regarding the Company and its mineral properties. All values are in U.S. Dollars unless otherwise stated.
Forward-Looking Statements
GOLDQUEST MINING CORP. CORPORATE PRESENTATION
3
TSX-V:GQC | GOLDQUESTCORP.COM | JANUARY 2016
AFTER TAX
AuEq.**
Our 2012 Romero Discovery
GoldQuest – Established as an Emerging Developer
LTP-94
158.6m to 160.0m 288.6 g/t Gold 5.6% Copper * Preliminary Economic Assessment (“PEA”), Net Present Value (“NPV”), Internal Rate of Return (“IRR”), All-In Sustaining Costs (“AISC”) ** Gold Equivalent (“AuEq.”) ounces are calculated as follows: Au oz. payable + ((Cu lbs. payable * $2.90/lb.) + (Ag oz. payable * $17/oz.))/$1,225 oz.)
Pre-Feasibility Study in Progress – Due Q2 2016
GOLDQUEST MINING CORP. CORPORATE PRESENTATION
4
TSX-V:GQC | GOLDQUESTCORP.COM | JANUARY 2016
instrumental in the development of the Cerro de Maimon copper/gold mine (2008).
Construction Manager for Cerro de Maimon
The Right Team with a Proven Track Record of Building Mines in the Dominican Republic GoldQuest Team - The Right People
Bill Fisher – Executive Chairman
Julio Espaillat – CEO
Extensive Mining Experience In The Dominican Republic
Julio Espaillat, CEO & Bill Fisher, Executive Chairman
GOLDQUEST MINING CORP. CORPORATE PRESENTATION
5
TSX-V:GQC | GOLDQUESTCORP.COM | JANUARY 2016
ROMERO PROJECT Santo Domingo City Santiago City San Juan City
Falcondo Mine Pueblo Viejo Mine (>15M oz. Gold) Cerro de Maimon Mine
No Government Royalties Reasonable Taxes A Good Place to do Business
Dominican Republic – The Right Place
Dominican Republic Florida Cuba
OPTIMIZED PEA METRICS LEADING INTO PREFEASIBILITY STUDY
GOLDQUEST MINING CORP. CORPORATE PRESENTATION
6
TSX-V:GQC | GOLDQUESTCORP.COM | JANUARY 2016
GOLDQUEST MINING CORP. CORPORATE PRESENTATION
7
TSX-V:GQC | GOLDQUESTCORP.COM | JANUARY 2016
Proposed Mine Plan
CONCEPTUAL RENDERING
high gold content
and fill mining methods
DEVELOPMENT 2015 PEA MINE PLAN RESOURCE SHELL
GOLDQUEST MINING CORP. CORPORATE PRESENTATION
8
TSX-V:GQC | GOLDQUESTCORP.COM | JANUARY 2016
7.7 Mt plan only, in core of 19.4 Mt Indicated Resource BIG upside around PEA plan
81,025 118,190 150,335 151,212 137,035 117,071 101,434 95,911 61,984 16,445
20,000 40,000 60,000 80,000 100,000 120,000 140,000 160,000
1 2 3 4 5 6 7 8 9 10
Ounces of Gold & Gold Eq. in Concentrate Production Years
Gold Gold Eq. (Silver) Gold Eq. (Copper)
GOAL: maintain or exceed 150,000 oz per year
Production Profile Mine #1 = Cu/Au con only
$219M
NPV6%
IRR
AFTER TAX
34%
PAYBACK
2.7
YEARS
AISC
$572/OZ.
AuEq.
(66% of Indicated Resource = Potential) * GQC’s product is a copper concentrate containing precious metals. Accordingly, the Company reports in gold equivalent terms because by revenue the precious metals represent 71%.
GOLDQUEST MINING CORP. CORPORATE PRESENTATION
9
TSX-V:GQC | GOLDQUESTCORP.COM | JANUARY 2016
CAPITAL
Contingency
$21.4M
Owner’s Cost
$3.1M
EPCM
$12.7M
Indirect Costs
$9.9M
Tailings Management Facility
$2.6M
Mining
$14.9M
On-Site Infrastructure
$26.1M
Site Development
$9.7M
Material Crushing & Handling
$7.1M
Processing Plant
$35.6M
DIRECT COSTS INDIRECT COSTS
Romero: Manageable Pre-Production Capital
AFTER TAX
34%
IRR
NPV6% $219M
PAYBACK
2.7
YEARS
AISC
$572/OZ.
AuEq.
GOLDQUEST MINING CORP. CORPORATE PRESENTATION
10
TSX-V:GQC | GOLDQUESTCORP.COM | JANUARY 2016
$0 $200 $400 $600 $800 $1,000 $1,200 $1,400
Gold Price
Gross Margin
AISC*
per oz. AuEq.
One of the lowest amongst the developers Romero: Low Operating Costs
$572/oz.
AuEq.
AISC*
NPV6% $219M
PAYBACK
2.7
YEARS
IRR
AFTER TAX
34%
* All-in Sustaining Costs (“AISC”) are presented less Corporate G&A Note: Gold Equivalent (“AuEq.”) ounces are calculated as follows: Au oz. payable + ((Cu lbs. payable * $2.90/lb.) + (Ag oz. payable * $17/oz.))/$1,225 oz.)
LOM ($/tonne) LOM ($/oz.)
Mining $30 $222 Processing $16 $117 Tailings Management $3 $20 G & A (Site) $5 $38 Total Cash Costs $54 $397 Transportation & Refining $10 $72 Royalties $2 $14 Sustaining & Closure $12 $90
All-in Sustaining Cost* $78 $572
GOLDQUEST MINING CORP. CORPORATE PRESENTATION
11
TSX-V:GQC | GOLDQUESTCORP.COM | JANUARY 2016
Very Robust at Significantly Lower Metal Prices Example: Using Jan 2016 Gold & Copper Pricing Approx.: Post tax NPV (6%) = US$175M & IRR = 25%
0% 5% 10% 15% 20% 25% 30% 35% 40% 45% 50% $0 $50 $100 $150 $200 $250 $300 $350 $900 $1,000 $1,100 $1,200 $1,300 $1,400 $1,500
IRR NPV (6%) – US$M
Gold Price
After Tax NPV 6% After Tax IRR
After Tax NPV (6%) and IRR Sensitivity to Gold Price
Romero: Low Capex, High IRR, Scalable Deposit
* Fixed Copper Price at $2.90 & Silver Price at $17
GOLDQUEST MINING CORP. CORPORATE PRESENTATION
12
TSX-V:GQC | GOLDQUESTCORP.COM | JANUARY 2016
Conceptual Development Timeline
2012 2013 2014 2015 2016 2017 2018 2019
EXPLORATION DISCOVERY DRILLING RESOURCE 1st PEA 2nd PEA PRE-FEASIBILITY FEASIBILITY
PERMITTING STUDIES
APPLICATION
Prep period
POTENTIAL CONSTRUCTION POTENTIAL PRODUCTION
MAY 2012 ROMERO DISCOVERY MAY 2014 1st PEA (MICON) MAY 2015 2nd PEA (JDS)
Well Understood Process We’ve done it before - We’re doing it again Pre-Feasibility Study to cost $3.1 million (drilling completed)
GOLDQUEST MINING CORP. CORPORATE PRESENTATION
13
TSX-V:GQC | GOLDQUESTCORP.COM | JANUARY 2016
Upside of our Scalable Mine Plan
TOTAL INDICATED RESOURCE
Further Potential – Romero South Indicated & Inferred
Revised PEA Mine Plan REMAINING INDICATED REMAINING INFERRED
TOTAL INFERRED RESOURCE Mine Plan 34% 6.6 MT ROMERO (not in Mine Plan) 55% 10.7 MT
ROMERO SOUTH (not in Mine Plan) 11% 2.1 MT
Mine Plan 11% 1.1 MT
ROMERO SOUTH (not in Mine Plan) 15% 1.5 MT
ROMERO (not in Mine Plan) 74% 7.4 MT
GRADE OF MINE PLAN
4.0 g/t Au 0.8 % Cu 4.3 g/t Ag 5.4 g/t AuEq
FAVOURABLE POSITION WITHIN PEER GROUP
GOLDQUEST MINING CORP. CORPORATE PRESENTATION
14
TSX-V:GQC | GOLDQUESTCORP.COM | JANUARY 2016
Treasury Metals Belo Sun Continental Dalradian Kaminak Sabina Roxgold
GOLDQUEST MINING CORP. CORPORATE PRESENTATION
15
TSX-V:GQC | GOLDQUESTCORP.COM | JANUARY 2016
Comps
Peer Comparison - Capital Efficiency
We’ve Raised Less…
40 60 80 100 120 140
$ Spent / oz of M and I Gold
1 2 3 4 5 6
100 150 200 250 300
We’ve Spent Less… Developing A Good Sized Deposit… Not Reflected in Market Cap
M and I Resources (Millions oz gold Eq.) Mkt Cap / oz of M and I Gold Group Average = $57/oz* GoldQuest = $11/oz
*excludes Roxgold
50 100 150 200 250
$M Q4 2015 $M Spent
GOLDQUEST MINING CORP. CORPORATE PRESENTATION
16
TSX-V:GQC | GOLDQUESTCORP.COM | JANUARY 2016
Comps
Peer Comparison Capital Payback Period (After-tax)
1 2 3 4 5 6 Payback Years
Competitive – Romero pays back before peak production
Less than 3 year payback projects
GOLDQUEST MINING CORP. CORPORATE PRESENTATION
17
TSX-V:GQC | GOLDQUESTCORP.COM | JANUARY 2016
Comps
Peer Comparison IRR (After-tax)
0% 5% 10% 15% 20% 25% 30% 35% 40% 45% 50% IRR % * GQC used a 6% discount rate
High Rate of Return confirms Romero is a robust project
Plus 30% IRR
GOLDQUEST MINING CORP. CORPORATE PRESENTATION
18
TSX-V:GQC | GOLDQUESTCORP.COM | JANUARY 2016
TSX-V:GQC | GOLDQUESTCORP.COM | JANUARY 2016
Airborne Magnetics
Exploring multiple prospects using systematic approach Romero = Mag Lows
ROMERO ROMERO SOUTH
Deposits are found in magnetic lows due to hydrothermal magnetitedestruction
Airborne Magnetics IP Mapping Surface Sampling Drilling
Mag Lows: Blue Mag Highs: Red
N
TSX-V:GQC | GOLDQUESTCORP.COM | JANUARY 2016
Fig 2
Fig 2: IP highs over mag lows
ROMERO ROMERO SOUTH
Deposits found within chargeability highs(in pink) due to the presence of sulphides
Fig 1: Romero = IP Highs Fig 1
N
IP Highs: Red IP Lows: Blue
Ground IP
Airborne Magnetics IP Mapping Surface Sampling Drilling
TSX-V:GQC | GOLDQUESTCORP.COM | JANUARY 2016
Precipitate Gold Corp’s Ginger Ridge
Loma Viejo Pedro Jengibre
Loma Viejo Pedro East Mineros Ridge La Fortuna Imperial Los Tomates La Bestia North Guama
Jengibre NW
Toribio
N
First Ever Detailed Mapping
Airborne Magnetics IP Mapping Surface Sampling Drilling
Romero
Gold/Copper Mineral Resource
Romero South
Gold/Copper Mineral Resource
South Guama
TSX-V:GQC | GOLDQUESTCORP.COM | JANUARY 2016
Airborne Magnetics IP Mapping Surface Sampling Drilling
NB Cu map not shown for simplicity
Precipitate Gold Corp’s
Ginger Ridge
Gold: 10.0 g/t
Loma Viejo Pedro
Gold: 8.8 g/t Copper: 7.4%
Jengibre
Gold: 17.7 g/t Copper: 1.4%
Loma Viejo Pedro East
Gold: 42.0 g/t Copper: 2.2%
Mineros Ridge
Gold: 7.1 g/t Copper: 1.7%
La Fortuna
Gold: 3.2 g/t Copper: 1.4%
Imperial
Copper: 5.3%
La Bestia
Copper 2.4%
Romero
Gold/Copper Mineral Resource
Gold: 10.3 g/t Copper: 7.9%
North Guama
Copper: 34.0%
Toribio
Gold: 1.3 g/t
Select Grab Samples Highlight
Gold Copper
General Prospect Locations GQC G General Prospect Location PRG
~10 km: El Barrero
Gold: 2.42 g/t
Romero South
Gold/Copper Mineral Resource
Gold: 67.8 g/t Copper: 13.2%
South Guama
Copper: 17.2%
Gold emplacement associated with high temperature argillic alteration along the plate boundaries
N
Alteration & Rock Samples Highlights
Romero
Gold/Copper Mineral Resource
TSX-V:GQC | GOLDQUESTCORP.COM | JANUARY 2016
IP high: Red IP low: blue
N
Drilling Highlights 50 km of Gold and Copper Occurrences Confirms Outstanding Potential for New Discoveries
Airborne Magnetics IP Mapping Surface Sampling Drilling
2016 IP Program Continues to ‘Define and Refine’ Drill Targets
Precipitate Gold Corp’s
Ginger Ridge
18 m of 4.5 g/t
Loma Viejo Pedro
79.5 m of 0.5 g/t Gold
Loma Viejo Pedro East
Drill Target
Mineros Ridge
Drill Target
La Fortuna
Drill Target
Imperial Hydrothermal System
>225 m pyrite
La Bestia Hydrothermal System
>300 m pyrite
Romero Hydrothermal System Gold/Copper Mineral Resource
234 m 7.9 g/t Gold + 1.4% Copper >200 m pyrite
Toribio
Drill Target
Jengibre
40 m 1.4 g/t Gold
North Guama
Drill Target
Romero South Hydrothermal System Gold/Copper Mineral Resource
26 m of 11.4 g/t Gold Drilling Highlights
General Prospect Location GQC General Prospect Location PRG
GOLDQUEST MINING CORP. CORPORATE PRESENTATION
25
TSX-V:GQC | GOLDQUESTCORP.COM | JANUARY 2016
GoldQuest Summary
GOLDQUEST MINING CORP. CORPORATE PRESENTATION
26
TSX-V:GQC | GOLDQUESTCORP.COM | JANUARY 2016
ROMERO: Fully Scalable
GoldQuest – An Emerging Developer with Exploration upside
Upcoming News Headings - 2016
Directors Bill Fisher Executive Chairman Julio Espaillat Florian Siegfried Patrick Michaels Frank Balint Management Julio Espaillat CEO Paul Robertson CFO Jeremy Niemi VP Exploration JP Le Blanc Consulting Engineer Contact Info: Bill FIsher +1-416-583-5797 bfisher@goldquestcorp.com Jason Roy +1-416 755-3575 jroy@presmont.com
SHARE PRICE* $0.14 3 YEAR RANGE* $2.03 - $0.04 SHARES OUTSTANDING* 177,682,225 FULLY DILUTED SHARES* 209,453,479 NET MARKET CAPITALIZATION* C$24.9 million CASH & CASH EQUIVALENTS** C$4.4 million
GoldQuest Mining Corp. 133 Richmond Street, Suite 501 Toronto, ON M5H 2L3 Canada
* As at January 21, 2016 ** Cash Position as at December 31, 2015
GOLDQUEST MINING CORP. CORPORATE PRESENTATION
29
TSX-V:GQC | GOLDQUESTCORP.COM | JANUARY 2016
MINERAL RESOURCE – ROMERO PROJECT
Category Zone Tonnes (Mt) Au (g/t) Cu (%) Zn (%) Ag (g/t) AuEq (g/t) Au (Moz)
AuEq (Moz)
INDICATED ROMERO
17.3 2.55 0.68 0.30 4.0 3.81 1.42 2.12
ROMERO SOUTH
2.1 3.33 0.23 0.17 1.5 3.8 0.23 0.26
TOTAL INDICATED RESOURCES
19.4 2.63 0.63 0.29 3.7 3.81 1.65 2.38
INFERRED ROMERO
8.5 1.59 0.39 0.46 4.0 2.47 0.44 0.68
ROMERO SOUTH
1.5 1.92 0.19 0.18 2.3 2.33 0.09 0.11
TOTAL INFERRED RESOURCES
10.0 1.64 0.36 0.42 3.8 2.45 0.53 0.79
* Mineral Resource for Romero and Romero South estimated by Micon International. Limited. Technical Report Published December 13, 2013 (effective date October 29, 2013). ** Mineral resources that are not mineral reserves do not have demonstrated economic viability. There is no certainty that the mineral resources will be categorized as mineral reserves.
Mineral Resource Tables
Discount Rate Pre-Tax NPV (US$M) After-Tax NPV (US$M) 0% 530 343 5% 379 236 7% 332 203 8% 311 188 10% 272 161
NPV at Various Discount Rates
GOLDQUEST MINING CORP. CORPORATE PRESENTATION
30
TSX-V:GQC | GOLDQUESTCORP.COM | JANUARY 2016
Moderate Sizing – BIG Upside around PEA plan
20,000 40,000 60,000 80,000 100,000 120,000 140,000
1 2 3 4 5 6 7 8 9 10
Ounces of Gold & Gold Eq. in Concentrate Production Years
Gold
GOAL: maintain or exceed 120,000 oz of gold per year
APPENDIX A: Production Profile GOLD ONLY
$219M
NPV6%
IRR
AFTER TAX
34%
PAYBACK
2.7
YEARS
AISC
$572/OZ.
AuEq.
(66% of Indicated Resource = Potential) * GQC’s product is a copper concentrate containing precious metals. Accordingly, the Company reports in gold equivalent terms because by revenue the precious metals represent 71%.
GOLDQUEST MINING CORP. CORPORATE PRESENTATION
31
TSX-V:GQC | GOLDQUESTCORP.COM | JANUARY 2016
$0 $200 $400 $600 $800 $1,000 $1,200 $1,400
Gold Price
Gross Margin
AISC*
per oz. Au
One of the lowest amongst the developers APPENDIX A: Low Operating Costs GOLD ONLY
$572/oz.
AuEq.
AISC*
NPV6% $219M
PAYBACK
2.7
YEARS
IRR
AFTER TAX
34%
* Based on 725k oz. payable over LOM ** Calculated by ((127M lb. Cu payable * $2.90)+(298k oz. Ag payable * $17))/725k oz. Payable
$/t
Processed
$/Au oz. Payable*
Mining
$30 $316
Processing
$16 $166
Tailings Management
$3 $28
G & A (Site)
$5 $53
Total On-Site Cash Costs $54 $685 Less: Cu + Ag By-Product Credits
Transportation & Refining
$10 $102
Royalties
$2 $20
Sustaining & Closure
$12 $127
All-in Sustaining Cost* $78 $298
GOLDQUEST MINING CORP. CORPORATE PRESENTATION
32
TSX-V:GQC | GOLDQUESTCORP.COM | JANUARY 2016
1km ROMERO ROMERO SOUTH
PORTAL PROCESS PLANT DRY STACK TAILINGS 35km to San Juan City (150K pop.) CAMP
Proposed Mine Plan
Revised Mine Plan contemplates extraction from Romero only
Base Camp at Hondo Valle Village
GOLDQUEST MINING CORP. CORPORATE PRESENTATION
33
TSX-V:GQC | GOLDQUESTCORP.COM | JANUARY 2016
PFS fully underway PFS costings +/-20% PFS is designed to complete all trade off studies including mine expansions etc Site visits Dec 2015 Subcontractors include Micon, Golder, ALS Global, Dolcasa Weekly meetings keep the process live On track for Q2 2016 FS – to follow seamlessly from the PFS FS costings +/-10% FS designed to refine the chosen PFS selection of plan Will be “bankable” Due Q4 2016
* As of September, 2015
The MetChem PFS/FS