ALL-EL ELECTRIC TRAN ECTRIC TRANSIT SIT BUSES USES BYD MOTORS - - PowerPoint PPT Presentation

all el electric tran ectric transit sit buses uses
SMART_READER_LITE
LIVE PREVIEW

ALL-EL ELECTRIC TRAN ECTRIC TRANSIT SIT BUSES USES BYD MOTORS - - PowerPoint PPT Presentation

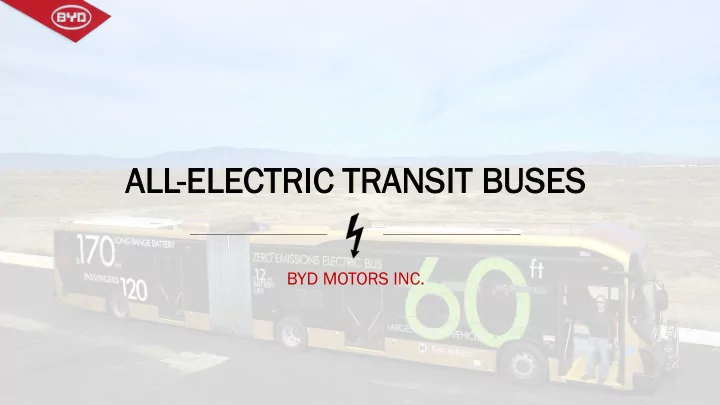
ALL-EL ELECTRIC TRAN ECTRIC TRANSIT SIT BUSES USES BYD MOTORS INC. Company Profile & Acknowledgments BYD was founded in 1995 with a $300k family investment and today has grown to $9 Billi llion on in annual revenue. BYD is the


slide-1
SLIDE 1

ALL-EL ELECTRIC TRAN ECTRIC TRANSIT SIT BUSES USES

BYD MOTORS INC.

slide-2
SLIDE 2

Company Profile & Acknowledgments

  • BYD was founded in 1995 with a $300k family investment and today has grown

to $9 Billi llion

  • n in annual revenue.
  • BYD is the Worlds largest manufacturer of rechargeable batteries.
  • BYD entered automotive market in 2003 and today is the Worlds largest

manufacturer of Battery Electric Buses.

  • As of October 2015, BYD achieved 6 consecutive months as the World leader

in EV sales.

  • As of October 2015, BYD also ranks 1st in total EV sales with 43,069 units sold.
slide-3
SLIDE 3

Company Profile & Acknowledgments

  • Today 60% of BYD’s public shares are owned by American investors.
  • Warren Buffet’s Berkshi

hire Hathaway is BYD’s D’s sing ngle larg rgest publi blic share rehold holder r at 10%.

  • In 2015, BYD was ranked #15 in Fortune Magazine’s “51 Companies That are

Changing the World” list.

  • In 2010, Bloomberg named BYD a top global technology company.
slide-4
SLIDE 4

Company Profile

  • 9 Billion in Annual Revenue
  • 180,000 Employees Worldwide
slide-5
SLIDE 5

BYD Provides Green Sustainable Solutions for the Global Community

slide-6
SLIDE 6

Clean Energy Focus

Solar Power Energy Storage LED Lighting

slide-7
SLIDE 7
slide-8
SLIDE 8

90 mph

Environmentally-Friendly Battery

0 Emissions

Fire Safe

187 Miles

Large Luggage Space Spacious Interior Spacious Interior Low Center of Gravity No Heavy Metals

slide-9
SLIDE 9

All-Electric Transit Fleet

slide-10
SLIDE 10

Global Popularity

Brazil Amsterdam Milan Israel Hong Kong Beijing Nanjing Hangzhou G-Trans, Gardena Los Angeles Metro Transit Authority Antelope Valley Transit Authority Stanford University Long Beach Transit Denver RTD Link Transit, Washington Columbia, Missouri SolTrans, Vallejo

slide-11
SLIDE 11

All-Electric Transit Fleet

  • BYD has a current offering of 7 different Transit Bus and Motor Coach models.
  • 3,000+ buses in World wide operation today with over 75M miles of data.
  • 6,000 buses on order for 2016 World Wide
  • Direct replacement for 80% of all bus routes in US today.
  • No change in operations, business as normal with better uptime and lower cost.
slide-12
SLIDE 12

Why Go All-Electric? Because it is time!

Int ntroducin ing t g the e BYD K D K7 30’ T Tran ansit sit

slide-13
SLIDE 13

Why Go All-Electric? Because it is time!

In Intr troducing the the BYD YD K9 K9 35’ & 35’ & 40’ T 40’ Tra ransit

slide-14
SLIDE 14

Why Go All-Electric? Because it is time!

Int ntroducin ing t g the e BYD K D K1 60’ T Tran ansit sit

slide-15
SLIDE 15

Why Go All-Electric? Because it is time!

Int ntroducin ing t g the e BYD C6 D C6 23’ M Motor Co Coach ach

slide-16
SLIDE 16

Why Go All-Electric? Because it is time!

Int ntroducin ing t g the e BYD C9 D C9 40’ M Motor Co Coach ach

slide-17
SLIDE 17

Why Go All-Electric? Because it is time!

Int ntroducin ing t g the e BYD C1 D C10 45’ M Motor Co Coach ach

slide-18
SLIDE 18

Why Go All-Electric?

  • ZERO

RO emissions, Zero CO2, NOx, PM emissions

  • Total L

l Lifecy ecycle le cost savings far above traditional technologies

  • Redund

ndan ant drive systems

  • 12 y

year ar battery warranty significantly reduces lifecycle cost

  • No Haz

azar ardous UR UREA EA to store and dispense

  • No

No DPF t DPF to c

  • clean

an, no soot to dispose of as EPA regulated Hazardous Waste

slide-19
SLIDE 19

Why Go All-Electric Reason #1 No Emissions

  • What

hat are are some of

  • f the

the e envir vironment ntal al bene nefit its? ZER ERO EMI EMISSIONS

  • Carb

rbon dio ioxid xide ( (CO2): a 121-ton reduction per year, per electric bus. Over the anticipated 12 year lifetime of the bus, this equates to 1,452 tons per bus.

  • Nit

itrogen Ox Oxides ( (NOx Ox): less 0.5938 tons per year, or 7.1256 tons over the lifetime of the bus.

  • Particulate ma

matter ( r (PM): reduced by 0.0274 tons per year, or 0.3288 tons over the 12 year lifespan of each electric bus.

  • Carb

rbon mo monoxide ( (CO) O): reduced 0.310 tons annually or 3.72 tons over the lifetime of the bus.

  • Hyd

ydroca carbons ns (H (HC): C): reduced by 0.0428 tons per year or 0.5136 tons over the 12 year lifespan of each bus.

slide-20
SLIDE 20

Why Go All-Electric Reason #1 No Emissions

  • Redu

educed ed em emissi ssions lea s lead to red educed o ed occ ccurren ence ces o s of il illne ness. HEA EALTH BENEF BENEFITS

According to the EPA’s ’s Diesel l Emissions

  • ns Quant

ntifier Healt lth Be Bene nefits Methodology: The reduction in particulate matter from just one electric bus is equivalent to about $55,000 in health benefits savings annually; and over the anticipated 12 year lifetime of the bus, annual health benefit savings are estimated at about $660,000. A fleet of 18 running on the ART would have a savings of $11,880,000

slide-21
SLIDE 21

Why Go All-Electric Reason #1 No Emissions

  • CNG

G PM 2 2.5 .5 ref ef: h : http://www3.ep epa.g .gov/pm/h /health.h .html

  • The size of particles is directly linked to their potential for causing health problems. Small

particles less than 10 micrometers in diameter pose the greatest problems, because they can get deep into your lungs, and some may even get into your bloodstream.

  • He

Health Effect cts

  • Particle pollution - especially fine particles - contains microscopic solids or liquid droplets that

are so small that they can get deep into the lungs and cause serious health problems. Numerous scientific studies have linked particle pollution exposure to a variety of problems, including:

  • premature death in people with heart or lung disease,
  • nonfatal heart attacks,
  • irregular heartbeat,
  • aggravated asthma,
  • decreased lung function, and
  • increased respiratory symptoms, such as irritation of the airways, coughing or difficulty

breathing.

slide-22
SLIDE 22

Why Go All-Electric Reason #2 Life Cycle Cost

  • Cos
  • st S

Saving vings thr through re reduced maint maintenan nance

Battery electric buses can save anywhere between 60-80% in operational cost. With a fraction of the moving parts there are fewer things to fail in a battery electric bus. No Hazardous UREA to store and dispense, No DPF to clean, no EPA regulated Hazardous Waste, no oil or filter disposal. Fewer preventative maintenance inspections means less down time.

slide-23
SLIDE 23

Why Go All-Electric Reason #2 Energy Cost

slide-24
SLIDE 24

Why Go All-Electric Reason #2 Cost Data

Odometer Reading Miles Driven

Vehicle R/M Exp Fuel Gallons 13-14 14-15 7//14-6/30/15 4149 4,688.85 1,293.8 144,830.0 151,697.0 6,867.0 4324 9,145.84 1,214.3 138,070.0 146,127.0 8,057.0 4335 6,123.50 2,042.4 139,602.0 151,880.0 12,278.0 4336 8,234.28 1,905.9 128,819.0 140,030.0 11,211.0 4449 9,622.50 1,989.7 138,833.0 149,833.0 11,000.0 4450 8,547.38 2,933.8 129,221.0 144,371.0 15,150.0 4617 13,603.84 3,464.1 119,525.0 140,693.0 21,168.0 4661 12,302.02 2,698.7 86,693.0 103,315.0 16,622.0 4672 10,820.39 3,218.4 86,677.0 106,183.0 19,506.0 4824 7,103.37 3,101.1 31,034.0 46,451.0 15,417.0 4837 1,422.07 1,605.0 27,317.0 36,396.0 9,079.0 Average R/M Average Miles Average Miles 8,425.09 2,315.2 13,305.0 1.606620466 5.746803732 MCPM MPG

slide-25
SLIDE 25

Why Go All-Electric Reason #2 Total LCCA

slide-26
SLIDE 26

Why Go All-Electric Reason #2 Operational Cost

slide-27
SLIDE 27

20 year fleet total cost

Description Cost QTY Description Cost QTY Diesel Bus Cost $ 140,000.00 2 $ 280,000.00 BYD Bus Cost $ 450,000.00 1 $ 450,000.00 Repair, Maint, Fuel $ 54,072.00 20 $ 1,081,440.00 Interest $ 182,350.94 1 $ 182,350.94 Repair, Maint, Energy $ 7,068.00 20 $ 141,360.00 20 year lifecycle cost per vehicle $ 1,361,440.00 20 year lifecycle cost per vehicle $ 773,710.94 Total Fleet Cost 20 years $ 16,337,280.00 Total Fleet Cost 20 years $ 9,284,531.28 20 year savings on a fleet of 12 BYD buses $ 7,052,748.72

slide-28
SLIDE 28

Why Go All-Electric Reason #3 Redundant Drive

Drive-axle diameter Motor diameter Type BYD-3425TZA Max power 90kw Average power 60kw Max torque 1,106 Ft/Lbs Max rotate speed 5000rpm Motor quantity 2 Ratio 10 Brake Knorr Gradeability ≥18%

  • High-efficiency, in-wheel traction motors deliver an impressive 1,106 Ft/Lbs. of torque
  • 30K Fluid replacement allows for simplified maintenance
  • Energy recovery and battery recharging through optimal regenerative braking reduces brake component

wear

slide-29
SLIDE 29
  • Hundreds of moving parts instead of Thousands
  • 30K Fluid replacement allows for simplified maintenance
  • Solid State Components

Why Go All-Electric Reason #3 Less is More

slide-30
SLIDE 30

The first st battery designed specifically for use in v vehicle les

  • BYD batteries have a 40+ year

service life

  • 70% capacity even after 10,000

cycles = 28 years

Reliability & Longevity

  • No propensity for fire or explosion

even under the most stressful conditions

Safety

  • Zero emissions and zero pollution
  • 100% Recyclable, no heavy metals
  • r caustic materials

Sustainability

Ther ermal B Bal alanc ncing ing A Across C Cel ell

Why Go All-Electric Reason #4 Superior Batteries

slide-31
SLIDE 31

Why Go All-Electric Reason #4 Superior Batteries

BYD Lit D Lithium ium-io ion Ir Iron

  • n-Pho

Phosph phate Bat atter ery Modu

  • dule
  • Long Life Tested 10,000 cycles with
  • ver 70% capacity
  • 10k/365=27.4 years
  • At 83 miles a day, two days of
  • peration per cycle.
  • High energy output and high

energy density average

  • Stable performance in both high and

low temperatures from 140F to -22F

slide-32
SLIDE 32

Why Go All-Electric? #7 Bi-Directional Inverters

V2L Emergency Response

  • One 40’ BYD bus can power a Red

Cross Medical Tent for a week.

V2V Rolling Generators

  • Utilize a bus to charge other fleet

vehicles.

V2L Peak Demand Shaving

  • Utilize Vehicles as Energy Storage to

feed back to grid during peak demand.

slide-33
SLIDE 33

BYD K7M Body Structure

slide-34
SLIDE 34

BYD Battery Layout and Weight Distribution

slide-35
SLIDE 35

How to Go All-Electric?

  • Sim

imple ins instal tallati ation n – each BYD vehicle includes an easy to install and operate charging interface

slide-36
SLIDE 36

Net-Zero Power, Pollution, Impact What does “Off-Grid” Mean?

Collect solar power all day, charge buses from storage at night

10, operating 40-foot Electric Buses: Energy function: 8 hours of sunlight x 405 kW of Solar = 3240 kWh generated 3, 1.1 MWh ESS containers = 3300 kWh “storage capacity” OK 3, 300 kW inverters can discharge = 900 kW rate OK Power interfaces/ ESS charge 10 buses at 80 kW = 800 kW OK 10 buses x 324 kWh energy needed = 3240 kWh - OK

slide-37
SLIDE 37

Example: 132 kW Solar System – Bonaire Transit

slide-38
SLIDE 38

Example: 132 kW Solar System – Bonaire Transit

slide-39
SLIDE 39

Example: 132 kW Solar System – Bonaire Transit

slide-40
SLIDE 40