
9/13/2010 1
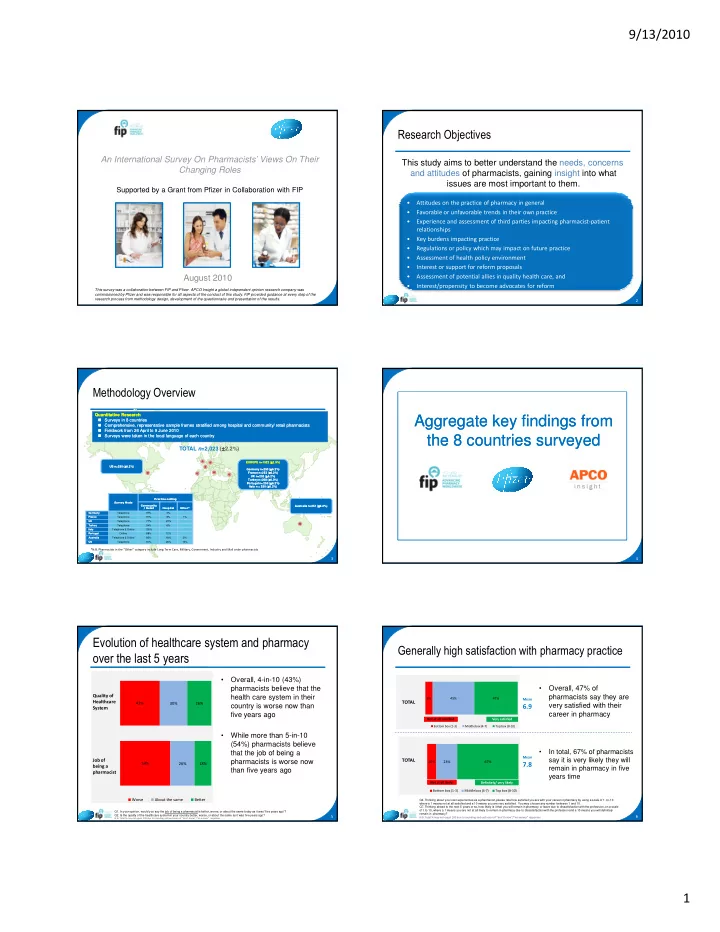
An International Survey On Pharmacists’ Views On Their Changing Roles
Supported by a Grant from Pfizer in Collaboration with FIP
August 2010
This survey was a collaboration between FIP and Pfizer. APCO Insight a global independent opinion research company was commissioned by Pfizer and was responsible for all aspects of the conduct of this study. FIP provided guidance at every step of the research process from methodology design, development of the questionnaire and presentation of the results.
- This study aims to better understand the needs, concerns
and attitudes of pharmacists, gaining insight into what issues are most important to them.
2
- Attitudes on the practice of pharmacy in general
- Favorable or unfavorable trends in their own practice
- Experience and assessment of third parties impacting pharmacist-patient
relationships
- Key burdens impacting practice
- Regulations or policy which may impact on future practice
- Assessment of health policy environment
- Interest or support for reform proposals
- Assessment of potential allies in quality health care, and
- Interest/propensity to become advocates for reform
- US n=250 (
US n=250 (± ± ± ± ± ± ± ±6.2%) 6.2%) Australia n=251 ( Australia n=251 (± ± ± ± ± ± ± ±6.2%) 6.2%) EUROPE n=1522 ( EUROPE n=1522 (± ± ± ± ± ± ± ±2.5%) 2.5%) Germany n=250 ( Germany n=250 (± ± ± ± ± ± ± ±6.2%) 6.2%) France n=252 ( France n=252 (± ± ± ± ± ± ± ±6.2%) 6.2%) UK n=252 ( UK n=252 (± ± ± ± ± ± ± ±6.2%) 6.2%) Turkey n=268 ( Turkey n=268 (± ± ± ± ± ± ± ±6.0%) 6.0%) Portugal n= 250 ( Portugal n= 250 (± ± ± ± ± ± ± ±6.2%) 6.2%) Italy n = 250 ( Italy n = 250 (± ± ± ± ± ± ± ±6.2%) 6.2%)
Quantitative Research Quantitative Research
- Surveys in
Surveys in 8 8 countries countries
- Comprehensive, representative sample frames stratified among
Comprehensive, representative sample frames stratified among hospital and community/ retail pharmacists hospital and community/ retail pharmacists
- Fieldwork from 26 April to 9 June 2010
Fieldwork from 26 April to 9 June 2010
- Surveys were taken in the local language of each country
Surveys were taken in the local language of each country
- Germany
Germany Telephone 97% 3%
- France
France Telephone 91% 8% 1% UK UK Telephone 77% 23%
- Turkey
Turkey Telephone 94% 6%
- Italy
Italy Telephone & Online 100%
- Portugal
Portugal Online 88% 12%
- Australia
Australia Telephone & Online 80% 18% 2% US US Telephone 61% 26% 13%
3
TOTAL n=2,023 (± ± ± ±2.2%)
*N.B. Pharmacists in the “Other” category include Long Term Care, Military, Government, Industry and Mail order pharmacists
Aggregate key findings from Aggregate key findings from the 8 countries surveyed the 8 countries surveyed
4
- 5
- Q1. In your opinion, would you say the job of being a pharmacist is better, worse, or about the same today as it was “five years ago”?
- Q2. Is the quality of the healthcare system in your country better, worse, or about the same as it was five years ago?
N.B. Total % may not equal 100 due to rounding and exclusion of “don’t know”/”no answer” responses
43% 54% 30% 26% 26% 18% Worse About the same Better
Quality of Healthcare System
- Overall, 4-in-10 (43%)
pharmacists believe that the health care system in their country is worse now than five years ago
- While more than 5-in-10
(54%) pharmacists believe that the job of being a pharmacists is worse now than five years ago
Job of being a pharmacist
- 6
8% 45% 47% Bottom box (1-3) Middle box (4-7) Top box (8-10) Not at all satisfied Not at all satisfied Very satisfied Very satisfied Mean
6.9
TOTAL
- Q4. Thinking about your own experiences as a pharmacist, please rate how satisfied you are with your career in pharmacy by using a scale of 1 -to-10
where a 1 means not at all satisfied and a 10 means you are very satisfied. You may choose any number between 1 and 10.
- Q7. Thinking ahead to the next 5 years or so, how likely is it that you will remain in pharmacy or leave due to dissatisfaction with the profession, on a scale
- f 1 to 10, where a 1 means you are not at all likely to remain in pharmacy due to dissatisfaction with the profession and a 10 means you will definitely
remain in pharmacy? N.B. Total % may not equal 100 due to rounding and exclusion of “don’t know”/”no answer” responses
- Overall, 47% of
pharmacists say they are very satisfied with their career in pharmacy
10% 23% 67% Bottom box (1-3) Middle box (4-7) Top box (8-10) Mean
7.8
TOTAL
Definitely/ very likely Definitely/ very likely Not at all likely Not at all likely
- In total, 67% of pharmacists
say it is very likely they will remain in pharmacy in five years time