
SLIDE 1
Agenda 6:00 Introductions (Everyone: name, affiliation, goal for - - PowerPoint PPT Presentation
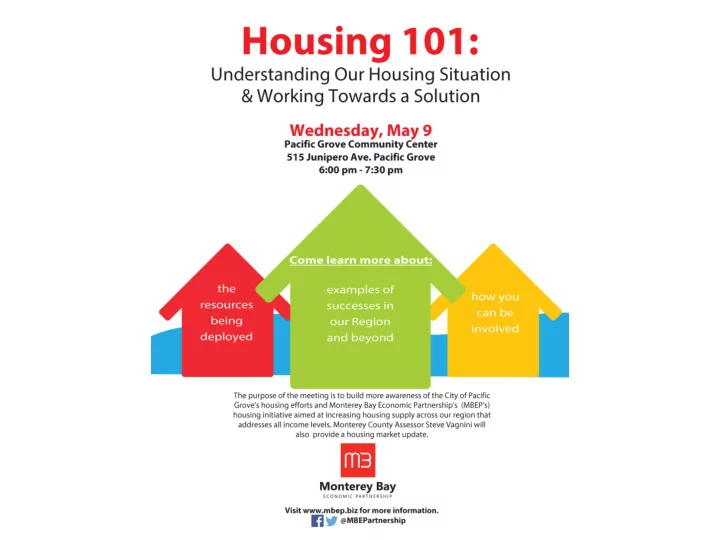
Agenda 6:00 Introductions (Everyone: name, affiliation, goal for tonight) 6:05 Housing Stories (Everyone shares with person next to them; 3 or 4 people share their story with the group) 6:25 Steve Vagnini, County Assessor (Housing Costs) 6:45
6:00 Introductions (Everyone: name, affiliation, goal for tonight) 6:05 Housing Stories (Everyone shares with person next to them; 3 or 4 people share their story with the group) 6:25 Steve Vagnini, County Assessor (Housing Costs) 6:45 MBEP Housing Initative And The 3-A’s for Understanding Housing 7:10 Pacific Grove Housing Ideas 7:30 Closing Remarks
A thriving region for all residents
To improve the economic health and quality of life in the region
Supported by regional leaders who are ready to make a difference
Chancellor UCSC
Claude Hoover
CEO Veritas RE
Bud Colligan
Founder & CEO South Swell Ventures
Ray Corpuz
City Manager Salinas
Larry deGhetaldi, MD
President PAMF, Santa Cruz
Lorri Koster
CEO Mann Packing
Mary Ann Leffel
President MCBC
René Mendez
City Manager Gonzales
George Ow, Jr.
Chairman Ow Family Properties
Bruce Taylor
CEO Taylor Farms
Nina Simon
Executive Director Museum of Art and History
Brad van Dam
CEO Marich Chocolates
Director, UCSC Institute
President CSUMB
Nan Mickiewicz, MD
CEO Dominican Hospital
Barbara Thompson
Senior Vice President Wells Fargo & Company
Carrie Birkhofer
President & CEO Bay Federal Credit Union
Policy|Projects
Nonprofit Private
“MBEP has done much in four short months to move from conversation to action in concrete ways that will help solve the housing problem in the region.”
Linda Mandolini, President, Eden Housing
ELECTIONS RELIGION EDUCATION PARKS JOBS SHOPPING MEDICAL TRANSIT
governments
Fuels the Local Economy
30% of gross household income.
Congress to increase above 30%.
Based on Area Median Income (AMI) adjusted for household size, federal, state, local programs use income ranges or “bands” to determine whether gross annual income (before taxes) low enough to qualify.
(MSA or county), half households above, half below ($81,400)
Monterey Bay Economic Partnership
$2,677 $2,373 $2,314 $2,137 $1,395
$1,000 $1,200 $1,400 $1,600 $1,800 $2,000 $2,200 $2,400 $2,600 $2,800 2011 2012 2013 2014 2015 2016
Median Rent (2016 dollars) Monterey City California Monterey County Salinas City U.S.
Source: Zillow Rental Index Multifamily, SFR, Condo/Co-op Time Series, January 2011 - December 2016
15% of families in the Monterey County area can afford a median price home
Monterey Bay Economic Partnership
60% 15%
0% 10% 20% 30% 40% 50% 60% 70% 80% 90% 2006 2007 2008 2009 2010 2011 2012 2013 2014 2015 2016
% of families that can afford a median price home
U.S. Salinas, CA MSA
The Housing Opportunity Index (HOI) for a given area is defined as the share of homes sold in that area that would have been affordable to a family earning the local median income, based on standard mortgage underwriting criteria. Source: National Association of Home Builders (2016). 2006-2016 NAHB - Wells Fargo Housing Opportunity Index (HOI)
Monterey Bay Economic Partnership
$0 $20,000 $40,000 $60,000 $80,000 $100,000 $120,000 $140,000 2005 2006 2007 2008 2009 2010 2011 2012 2013 2014 2015
Median Annual Earnings (2015 Dollars)
Doctors Computer related Education, training, and library Construction Building and grounds maintenance Food preparation and serving
Source: American Community Survey, 1-yr estimates, 2005-2015
Monterey Bay Economic Partnership
$591 $776 $786 $797 $930 $1,023 $1,053 $1,106 $1,199 $1,264 $1,308 $1,477 $1,557 $1,674 $2,176 $1,969 $2,586 $2,619 $2,656 $3,102 $3,411 $3,510 $3,686 $3,997 $4,212 $4,359 $4,922 $5,189 $5,580
$0 $1,000 $2,000 $3,000 $4,000 $5,000 $6,000
Accommodation and food services Other services Administrative, support and waste management Retail trade Arts, entertainment, and recreation Manufacturing Construction Health care and social assistance Real estate and rental and leasing Finance and insurance Information Educational services Professional, scientific, and technical services Public administration Median market rate rental
Median Monthly Income Rent
Affordable Rent rates calculated based on 30% income standard. Source: American Community Survey, 2015 5-yr estimates, Zillow Rental Index Multifamily, SFR, Condo/Co-op Time Series, January 2016
Conventional definition of “adequate” housing largely framed in terms of physical conditions:
leaky roof, subsiding foundation, failing materials and appliances
family cycle- and age-related, location
Analysis of “availability” typically located within market analyses of supply and demand. Is there an equilibrium or disequilibrium (mismatch) between what’s needed and available? Typically measured by:
needs v. # appropriate units
Join our Action Center http://www.mbep.biz/Housing/ActionCenter.aspx Bill Peake PG Councilmember Matt Huerta MBEP Program Manager mhuerta@mbep.biz