Agenda Background/Motivation ARISP Rotor Icing Model - - PowerPoint PPT Presentation

agenda
SMART_READER_LITE
LIVE PREVIEW

Agenda Background/Motivation ARISP Rotor Icing Model - - PowerPoint PPT Presentation

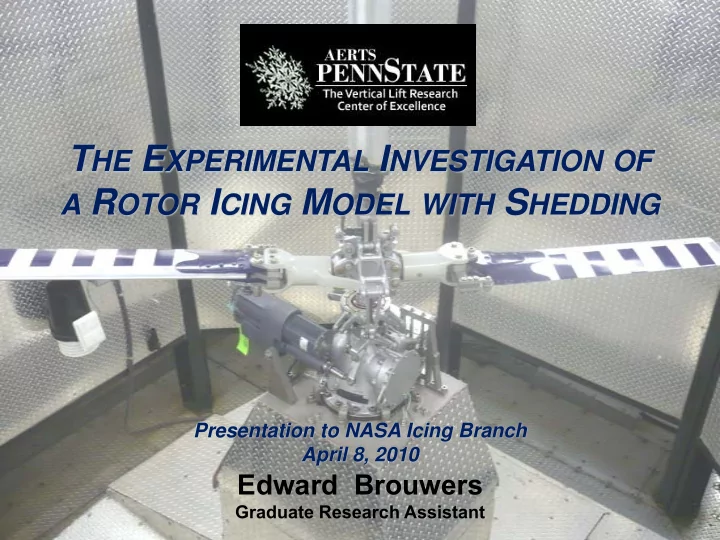
T HE E XPERIMENTAL I NVESTIGATION OF A R OTOR I CING M ODEL WITH S HEDDING Presentation to NASA Icing Branch April 8, 2010 Edward Brouwers Graduate Research Assistant The Vertical Lift Research Center of Excellence Adverse Environment Rotor


slide-1
SLIDE 1

Adverse Environment Rotor Test Stand The Vertical Lift Research Center of Excellence

Edward Brouwers

Graduate Research Assistant

THE EXPERIMENTAL INVESTIGATION OF

A ROTOR ICING MODEL WITH SHEDDING

Presentation to NASA Icing Branch April 8, 2010

slide-2
SLIDE 2

Adverse Environment Rotor Test Stand The Vertical Lift Research Center of Excellence

Agenda

  • Background/Motivation
  • ARISP Rotor Icing Model
  • Understanding AERTS
  • ARISP Correlations to AERTS Experiments
  • Conclusions & Recommendations for Future Work
slide-3
SLIDE 3

Adverse Environment Rotor Test Stand The Vertical Lift Research Center of Excellence

Motivation

  • Flight into Icing Conditions is Dangerous

– Reduced vehicle performance

  • Torque Rise
  • Stability & Control Issues
  • Excessive Vibration
  • Operational Limitations

– Simply avoid ice – Few aircraft have limited icing clearances – Fewer have IPS

  • Rotorcraft Compounding Factors

– Mission Urgency – Mission Profile – Vehicle Sensitivity to Ice – Shedding

slide-4
SLIDE 4

Adverse Environment Rotor Test Stand The Vertical Lift Research Center of Excellence

Rotor Icing Analysis

  • Test Facilities

– NRC Helicopter Spray Rig – McKinley Climatic Chamber – NASA IRT – Army HISS

NASA Photo C-1993-3962

  • Open Issues

– Oscillatory Airfoils – Tip Shape Effects

  • Modeling

– Complex problem – No comprehensive model – Lack of validation data

slide-5
SLIDE 5

Adverse Environment Rotor Test Stand The Vertical Lift Research Center of Excellence

Research Objectives

  • Develop Rotor Icing Model (ARISP)
  • Develop Icing Test Facility (AERTS)
  • Correlate ARISP Model to Experiments in AERTS Facility
slide-6
SLIDE 6

Adverse Environment Rotor Test Stand The Vertical Lift Research Center of Excellence

Agenda

  • Background/Motivation
  • ARISP Rotor Icing Model

– Program Design – Shedding/Performance Implementation – Validation

  • Understanding AERTS
  • ARISP Correlations to AERTS Experiments
  • Conclusions &

Recommendations for Future Work

slide-7
SLIDE 7

Adverse Environment Rotor Test Stand The Vertical Lift Research Center of Excellence

AERTS Rotor Icing, Shedding and Performance (ARISP) Model

  • Objectives

– Aid AERTS Calibration – Uncover Icing Trends – Supplement NRA Activity

  • Simplified version of icing analysis effort
  • Primary Features

– Prediction of ice accretion on rotor systems – Predict performance degradation – Evaluates effects of ice shedding – Provide interface for ice protection system evaluation

slide-8
SLIDE 8

Adverse Environment Rotor Test Stand The Vertical Lift Research Center of Excellence

Program Setup

  • Overall Setup

– Analysis centered on the LEWis ICE Accretion Program (LEWICE)

  • Industry standard icing modeling software – extensively validated in IRT
  • ARISP uses LEWICE 3.0 – 2D version

– Pre and post processing written in MATLAB – Generally similar to work by:

  • Britton, “Development of an Analytical Method to Predict Helicopter Main Rotor

Performance in Icing Conditions, AIAA 92-0418

  • Miller et al, “Analytical Determination of Propeller Performance Degradation Due to Ice

Accretion” J. Aircraft Vol. 24 No. 11

  • Fortin and Perron, “Spinning Rotor Blade Tests in Icing Wind Tunnel” AIAA 2009-4260
  • Concept

– Quasi-2D Analysis

  • Rotor performance calculated in BEMT
  • Ice accretions calculated at each station

– Focused on hover due to AERTS Facility limitations

slide-9
SLIDE 9

Adverse Environment Rotor Test Stand The Vertical Lift Research Center of Excellence

Overall Program Flow

Loop Until Analysis Complete

slide-10
SLIDE 10

Adverse Environment Rotor Test Stand The Vertical Lift Research Center of Excellence

LEWICE Interface

  • Program Inputs

– Rotor Geometry

  • Blade profile
  • Station properties (airfoil, material)
  • Analysis stations

– Icing Conditions

  • LWC function of rotor radius
  • Mono-dispersed droplet distribution assumed
  • Ramping of temperature/LWC
  • Software Coupling

– LEWICE time stepping logic is used to size number of analysis steps – Inputs for each station/timestep are created automatically

  • Airfoil Geometry – clean/iced airfoil
  • Icing Conditions – spanwise gradients in LWC etc

– Series of batch files connect MATLAB and LEWICE

  • LEWICE runs “inside” of MATLAB script
  • ~0.5 seconds per LEWICE run
  • High fidelity test run requires about 10 minutes
slide-11
SLIDE 11

Adverse Environment Rotor Test Stand The Vertical Lift Research Center of Excellence

ARISP BEMT Validation

Dry BEMT Module Comparison vs NASA CR 2275 Dry BEMT Module Comparison vs Prouty Tail Rotor

  • BEMT currently corrected for AERTS Chamber per NASA TM 86754
  • C81 Performance tables for NACA 0012, NACA 0015 included in ARISP
slide-12
SLIDE 12

Adverse Environment Rotor Test Stand The Vertical Lift Research Center of Excellence

ARISP Ice Accretion Comparisons Model Scale

  • Model Scale – NASA TM 103712
  • Tests conducted in NASA IRT (1989)

– 6’ diameter NACA 0012 generic rotor – Ice tracings published at various rotor stations for many icing conditions – Rotor trimmed in ARISP model to match average station AoA

slide-13
SLIDE 13

Adverse Environment Rotor Test Stand The Vertical Lift Research Center of Excellence

Full Scale ARISP Ice Shape Validation

  • Full Scale – NASA CR 168332

– Tests conducted at Canadian NRC Helicopter Spray Rig with UH-1H – Results from Flight E Documented – Conditions

  • Temperature corrected from -19°C to -14°C
  • LWC = 0.7 gr/m3
  • MVD = 30 µm
  • Time = 3 min
slide-14
SLIDE 14

Adverse Environment Rotor Test Stand The Vertical Lift Research Center of Excellence

Ice Extent Calculations

  • Method of determining spanwise ice accretion

– Based upon static temperature and ram temperature rise – Assumes thermodynamic recovery factor per NASA CR 3910 – Model validated to CR 3910 and UH-1H HIFT Data Validation

) , ( M LWC f

Current Research

slide-15
SLIDE 15

Adverse Environment Rotor Test Stand The Vertical Lift Research Center of Excellence

Ice Accretion Comments

  • Overprediction of Ice at Rotor Tips

– Opposite of expectations – Seen in previous research

  • NASA TM 107312
  • Gent, “Further Studies of Helicopter Rotor Ice

Protection Accretion and Protection” Vertica Vol 11 Issue 3, 1987

– May be related to droplet bounce, centrifugal effects and LWC gradients – Shedding

  • 2D nature of shedding analysis may miss shedding
  • f glaze ice horns

NASA TM 103712

slide-16
SLIDE 16

Adverse Environment Rotor Test Stand The Vertical Lift Research Center of Excellence

Performance Degradation

  • Modeling

– Primary metric is rotor torque

  • Dependent on sectional drag coefficients
  • Lift degradation small

– Empirically modeled based upon published correlations

  • Bragg’s and Flemming’s Correlations

currently included in ARISP

  • Implementation

– Dynamic database of sectional drag coefficients

  • Updated after each time step with ΔCd
  • If shedding occurs, clean airfoil

performance is used

Gray Bragg Flemming Temperature (°C) min

  • 17.7
  • 17.7
  • 20.0

max

  • 3.8
  • 12.2

7.7 MVD (µm) min 11.3 7.0 11.0 max 19.0 19.0 50.0 LWC (gr/m3) min 0.39 0.50 0.24 max 2.00 1.86 3.80 Velocity (ft/sec) min 183.3 256.6 287.7 max 403.3 403.3 745.1 Icing Time (min) min 3.0 1.0 0.3 max 17.7 27.0 5.0

slide-17
SLIDE 17

Adverse Environment Rotor Test Stand The Vertical Lift Research Center of Excellence

Shedding Implementation

Centrifugal Force Net Aerodynamic Force (negligible) Ice Forces Section A-A

X Y Z

Shear Adhesion Force Cohesion Force Analysis Direction Ω A A Differential Ice Element

slide-18
SLIDE 18

Adverse Environment Rotor Test Stand The Vertical Lift Research Center of Excellence

Shedding Progression

slide-19
SLIDE 19

Adverse Environment Rotor Test Stand The Vertical Lift Research Center of Excellence

Ice Details

X Y Z

Centrifugal Force Ice Adhesion Area Impingement Limits Calculated from LEWICE Typical Ice Shape, assumed quasi 2D Ice Cross Sectional Area shi slow

  • Impingement Limit Tracker

– Furthest aft impingement limits selected for each station (updated each time step, reset after shedding event) – Glaze ice feathers

  • Cross Ice Area Summation

– Area calculated by LEWICE (integration of thickness) – Summed for each timestep, reset after shedding event

slide-20
SLIDE 20

Adverse Environment Rotor Test Stand The Vertical Lift Research Center of Excellence

ARISP Model

Loop Until Analysis Complete

slide-21
SLIDE 21

Adverse Environment Rotor Test Stand The Vertical Lift Research Center of Excellence

Ice Properties

  • Ice Cohesive (Tensile) Strength

– Uses results from the work of Chu and Scavuzzo: “Tensile Properties of Impact Ices,” AIAA 92-0883

  • Ice Shear Adhesion Strength

– Currently taken from variety of sources:

  • Stallabrass and Price: “On the Adhesion of Ice

to Various Materials,” NRC Canada LR-350

  • Scavuzzo and Chu: “Structural Properties of

Impact Ices Accreted on Aircraft Structures,” NASA CR 179580

  • Reich: “Interface Influences Upon Ice

Adhesion to Airfoil Materials,” AIAA 94-0714

– Eventually calculated in the AERTS for each icing condition

  • Ice Density

– Macklin and Jones model included in ARISP model – All analysis presented uses Jones Model

Author Ice Density (kg/m3) Ashton 918 Macklin 900 Stallabrass 884 Jones 910 LEWICE 917

Ice Density T = -10°C, LWC = 1.5 gr/m3, MVD = 20 µm

Author/Date Method Aluminum Shear Adhesion Strength psi kPa Loughborough* 1946 Pull 81 558 Stallabrass and Price† 1962 Rotating Instrumented Beam 14 97 Itagaki† 1983 Rotating Rotor 4 - 23 27 - 157 Scavuzzo and Chu† 1987 Shear Window 13 - 42 90 - 290 Reich* 1994 Pull 130 896 PSU AERTS* Pull 76 526

Shear Adhesion Strength for Aluminum T = -11˚C

slide-22
SLIDE 22

Adverse Environment Rotor Test Stand The Vertical Lift Research Center of Excellence

Shear Adhesion Strength Calculation

  • Problem

– Shear adhesion strength is a function of icing condition – Data is characterized by significant scatter (± 35 %)

  • Variation due to test method – various mechanical methods
  • Variation due to test facility – limited velocity, ice transport
  • Approach

– Based upon work of Stallabrass and Price (NRC Canada LR-350, 1962)

  • Mount test coupons on instrumented beam at rotor tip
  • Monitor strain on beam to calculate shear adhesion strength

– Key Benefits

  • Test realistic icing conditions
  • Approach realistic rotorcraft tip speeds
  • Accrete ice and test in one facility
slide-23
SLIDE 23

Adverse Environment Rotor Test Stand The Vertical Lift Research Center of Excellence

Shedding Fixture Concept

slide-24
SLIDE 24

Adverse Environment Rotor Test Stand The Vertical Lift Research Center of Excellence

Implementation

Test Coupon Rotor (9’ diameter) Instrumented Beam Heated Fairing (shown transparent) Coupon Mounting Block Tailored strain field for instrumentation

slide-25
SLIDE 25

Adverse Environment Rotor Test Stand The Vertical Lift Research Center of Excellence

Implementation

Model of Instrumented Beam at Design Point 1200 rpm (565 ft/sec) Provision for de-ice heaters

slide-26
SLIDE 26

Adverse Environment Rotor Test Stand The Vertical Lift Research Center of Excellence

Beam Load (N) Voltage (V) Vo Lo LRPM VRPM LICE

Loading Line Equation determined by points (Vo,Lo) and (VRPM, LRPM)

VICE

Loading due to RPM Loading due to ice Extrapolated Loading Line Calculation Goal

Test Fixture Logic

slide-27
SLIDE 27

Adverse Environment Rotor Test Stand The Vertical Lift Research Center of Excellence 3.7 3.8 3.9 4 4.1 4.2 4.3 4.4 4.5 50 100 150 200 250 300 350 400 450

Voltage

RPM

400 Gain 500 Gain 400 Gain, + Mass 500 Gain, + Mass

500 gain 400 gain ΔV

y = -0.0003x2 + 0.0111x - 0.0003 R² = 0.9979

0.005 0.01 0.015 0.02 0.025 0.03 0.035 0.04 0.045 0.05 0.00 1.00 2.00 3.00 4.00 5.00 6.00

Delta Voltage (V) Beam Load (kg)

500 Gain

  • Poly. (500 Gain)

Shedding Fixture

Shedding fixture is capable of sensing small ice accretions – good SNR

slide-28
SLIDE 28

Adverse Environment Rotor Test Stand The Vertical Lift Research Center of Excellence

Icing Shakedown Testing

Blade Anti-Ice Heater Locations Heated Side Fairings Previous testing ice bridging

Problem: Ice Bridging Solution: Heater Fairings Problem: Blade Icing Solution: Anti-Ice Heaters

5 W/in2 Heater (20 per blade)

slide-29
SLIDE 29

Adverse Environment Rotor Test Stand The Vertical Lift Research Center of Excellence

Icing Shakedown Tests (con’t)

Notch Ice Accretions Runback Ice Problem: Notch Icing Solution: Additional Heater 10 W/in2 heater

slide-30
SLIDE 30

Adverse Environment Rotor Test Stand The Vertical Lift Research Center of Excellence

Icing Shakedown Tests (con’t)

Notch Ice Accretions Runback Ice Problem: Notch Icing Solution: Additional Heater 10 W/in2 heater

slide-31
SLIDE 31

Adverse Environment Rotor Test Stand The Vertical Lift Research Center of Excellence

Sample Shear Adhesion Test Fixture Raw Data

Loading due to accreted ice VRPM Shedding Event @ t = 403 s Rotor Spool Down Icing cloud on

Note long test time. Chamber temperature may increase significantly

slide-32
SLIDE 32

Adverse Environment Rotor Test Stand The Vertical Lift Research Center of Excellence

Shedding Fixture Test Results

0.00 100.00 200.00 300.00 400.00 500.00 600.00 700.00 800.00 900.00 1000.00

  • 30
  • 25
  • 20
  • 15
  • 10
  • 5

Shear Adhesion Strength (kPa) Temperature ( C)

AERTS (Current Research) Loughenborough (1946) Stallabrass and Price (1962) Itagaki (1983) Scavuzzo and Chu (1987) Reich (1994)

LWC = 10 gr/m3 MVD = 40 µm

slide-33
SLIDE 33

Adverse Environment Rotor Test Stand The Vertical Lift Research Center of Excellence

T = -10.0 °C LWC = 3.0 gr/m3 MVD = 40 µm t = 300 sec RPM = 800 Θ0 = 5°

Sample ARISP Outputs

slide-34
SLIDE 34

Adverse Environment Rotor Test Stand The Vertical Lift Research Center of Excellence

T = -5.0 °C LWC = 3.0 gr/m3 MVD = 40 µm t = 300 sec RPM = 800 Θ0 = 5°

Sample ARISP Outputs

slide-35
SLIDE 35

Adverse Environment Rotor Test Stand The Vertical Lift Research Center of Excellence

Agenda

  • Background/Motivation
  • ARISP Rotor Icing Model
  • Understanding AERTS

– CFD Modeling – Sensitivity Studies

  • ARISP Correlations to AERTS Experiments
  • Conclusions & Recommendations for Future Work
slide-36
SLIDE 36

Adverse Environment Rotor Test Stand The Vertical Lift Research Center of Excellence

CFD Modeling

  • Objective

– Understand complex flowfield in chamber (rotor in box) – Assist in particle trajectory analysis

  • Software: Solidworks Flow Simulation
slide-37
SLIDE 37

Adverse Environment Rotor Test Stand The Vertical Lift Research Center of Excellence

600 RPM Velocity Contours

NACA 0015 Rotor 7.75’ diameter 600 RPM Θo = 2.5°

slide-38
SLIDE 38

Adverse Environment Rotor Test Stand The Vertical Lift Research Center of Excellence

600 RPM Nozzle Flow Tubes

slide-39
SLIDE 39

Adverse Environment Rotor Test Stand The Vertical Lift Research Center of Excellence

600 RPM 20 µm Trajectories

slide-40
SLIDE 40

Adverse Environment Rotor Test Stand The Vertical Lift Research Center of Excellence

Sensitivity Studies

Tip Vortex Effect

  • AERTS is a unique facility
  • Series of tests were run to explore

AERTS icing envelope

– Temperature – Droplet Size – Nozzle Settings – Rotor RPM – Collective Pitch

  • Limits established for facility
  • Crystalization

– Erosion of ice shapes significant issue – Problem corrected with ice screens and corrected nozzle settings T ≈ -10°C, LWC ≈ 1.3 – 1.6 gr/m3

slide-41
SLIDE 41

Adverse Environment Rotor Test Stand The Vertical Lift Research Center of Excellence

Agenda

  • Background/Motivation
  • ARISP Rotor Icing Model
  • Understanding AERTS
  • ARISP Correlations to AERTS Experiments

– General Observations – Ice Shape/Torque/Shedding Correlations

  • Conclusions & Recommendations for Future Work
slide-42
SLIDE 42

Adverse Environment Rotor Test Stand The Vertical Lift Research Center of Excellence

Test Rotor

Parameter Schweizer 269C Application PSU AERTS Application Units Radius 13.42 3.87 ft Chord 6.8 in Solidity 0.040 0.092

  • Tip Speed

662 200 – 608 ft/sec RPM 471 500 - 1500

  • Twist (linear)
  • 8.7
  • 2.1

degrees Airfoil NACA 0015

  • LE Material

2024-T3 Aluminum

  • Weight

~1.33 lb/ft

  • Painted stripes provide consistent measuring points. Each

stripe is 0.05R wide.

  • The blade leading edge is not painted to allow for shedding
  • analysis. Ice accretes directly to an 2024-T3 aluminum

surface. Blades donated by Schweizer Aircraft Blade grips donated by Olympic Tool and Machine Corporation

slide-43
SLIDE 43

Adverse Environment Rotor Test Stand The Vertical Lift Research Center of Excellence

Test Cases

Case Temperature MVD Corrected LWC Nozzle Config RPM Collective Time Shedding Shedding Station °C µm gr/m3 deg sec ? 24

  • 10.75

25 2.0 5 Outer 500 2.5 180 N 25

  • 10.50

25 1.6 5 Outer 600 2.5 180 N 26

  • 10.85

35 1.2 5 Outer 600 2.5 180 N 27

  • 10.50

35 2.3 5 Outer 600 2.5 180 N 28

  • 15.60

15 2.0 5 Outer 600 2.5 180 N 29

  • 5.10

35 6.6 5 Outer 180 2.5 180 N 31

  • 5.80

35 3.0 5 Outer 600 2.5 215 Y 0.83 32

  • 9.90

35 2.8 5 Outer 600 2.5 300 N 33

  • 4.70

20 6.9 5 Outer 600 2.5 352 Y

0.77

34

  • 6.50

35 3.7 5 Outer 600 2.5 272 Y

0.87

35

  • 8.00

25 1.2 4 Outer 600 2.5 320 Y

0.83

36

  • 5.00

25 1.3 4 Outer 600 2.5 427 Y

0.81

37

  • 5.00

15 2.2 4 Outer 600 2.5 313 Y

0.75

38

  • 3.00

25 1.3 4 Outer 600 2.5 304 Y

0.79

39

  • 3.00

15 2.2 4 Outer 600 2.5 391 Y

0.82

40

  • 14.20

15 1.2 3 Outer 600 2.5 180 N 41

  • 12.00

15 0.9 3 Outer 600 2.5 180 N 43

  • 8.60

15 1.2 3 Outer 600 2.5 144 Y 0.72 44

  • 10.05

15 1.3 3 Outer 600 2.5 180 N Parameter Minimum Maximum Temperature (°C)

  • 15.6
  • 3.1

MVD (µm) 15 35 LWC (gr/m3) 0.9 6.5 Icing Time (s) 144 427

slide-44
SLIDE 44

Adverse Environment Rotor Test Stand The Vertical Lift Research Center of Excellence

Test Case Correlation to FAR Part 25/29 Appendix C Icing Envelope

slide-45
SLIDE 45

Adverse Environment Rotor Test Stand The Vertical Lift Research Center of Excellence

Typical Test Video

(.mov)

slide-46
SLIDE 46

Adverse Environment Rotor Test Stand The Vertical Lift Research Center of Excellence

Ice Accretion Results

slide-47
SLIDE 47

Adverse Environment Rotor Test Stand The Vertical Lift Research Center of Excellence

LWC Calculation

  • Calculated Experimentally

– No dedicated sensor, calculation based upon stagnation ice thickness – Significant errors may be generated – ARISP Model must be run after experiment

  • Results

– General root to tip gradient due to CF and flowfield effects

slide-48
SLIDE 48

Adverse Environment Rotor Test Stand The Vertical Lift Research Center of Excellence

Case 44 Shapes

slide-49
SLIDE 49

Adverse Environment Rotor Test Stand The Vertical Lift Research Center of Excellence

Qualitative Shape Correlation

Case Station 0.6r 0.7r 0.8r 0.9r

24

  • Y

Y G

25

  • Y

G Y

26

  • Y

Y R

27

  • Y

Y Y

28

  • R

R R

29

  • Y

R R

31

  • G

G G

32

  • G

G G

33

  • R

R Y

34

  • Y

G G

35

G G Y Y

36

R R R R

37

G G Y Y

38

G G Y Y

39

G G G G

40

G G G G

41

G G Y Y

43

G G

  • 44

G G G G

Red Case 29, 0.9r Yellow Case 24 0.9r Green Case 25, 0.8r

Best correlations at small particle size, low LWC

slide-50
SLIDE 50

Adverse Environment Rotor Test Stand The Vertical Lift Research Center of Excellence

Impingement Limits

slide-51
SLIDE 51

Adverse Environment Rotor Test Stand The Vertical Lift Research Center of Excellence

Torque Correlations

Torque Offset Calculation Case 31 Torque

  • Torque calibration runs were made to isolate rotor performance

– Removes influence of bearings and seals

  • Torque Correlations

– Shaft torque was monitored during all testing – Bragg’s correlations were used in all correlations

slide-52
SLIDE 52

Adverse Environment Rotor Test Stand The Vertical Lift Research Center of Excellence

Torque Correlations

Highest Temperatures

slide-53
SLIDE 53

Adverse Environment Rotor Test Stand The Vertical Lift Research Center of Excellence

Shedding

slide-54
SLIDE 54

Adverse Environment Rotor Test Stand The Vertical Lift Research Center of Excellence

Shedding Event Correlation

Shedding Station

LWC (gr/m3) indicated by each point

Shedding Time

LWC (gr/m3) indicated by each point

  • 9 Test Cases Involved Shedding Events

– Most events involved a single blade – All shedding occurred as a single event – Significant imbalance required test stand to be shut down immediately due to high 1/rev loads

slide-55
SLIDE 55

Adverse Environment Rotor Test Stand The Vertical Lift Research Center of Excellence

Shedding Correlations

  • Ice Properties

– Cohesive Strength: Chu and Scavuzzo: “Tensile Properties of Impact Ices,” AIAA 92-0883 – Shear Adhesion: Reich “Interface Influences Upon Ice Adhesion to Airfoil Materials,” AIAA 94-0714

  • Correction Factor

– ARISP generally overpredicted accreted ice shapes

  • Ice mass was therefore lower, generating

errors in the shedding analysis

  • Tip runback unpredicted

– Uncorrected, the ARISP model predicted multiple shedding events,

  • ccurring earlier

– Correction factor derived from ice areas

slide-56
SLIDE 56

Adverse Environment Rotor Test Stand The Vertical Lift Research Center of Excellence

Shedding Corrections

Case Shedding Event AERTS ARISP No Corrections C ARISP

  • rrections

Time (s) %R Time (s) %R Time (s) %R 31 1 215 0.82 130 0.82 160 0.81 33 1 352 0.77 100 0.93 150 0.92 2 210 0.64 300 0.72 3 320 0.93 34 1 272 0.87 70 0.97 120 0.90 2 150 0.73 220 0.71 3 210 0.97 35 1 320 0.83 85 0.99 123 0.99 2 107 0.92 151 0.84 3 160 0.76 268 0.69 4 245 0.99 5 266 0.92 6 309 0.61 36 1 427 0.81 170 0.91 2 270 0.68 37 1 313 0.75 94 0.88 135 0.94 2 167 0.69 188 0.72 3 261 0.88 38 1 304 0.79 91 0.95 101 0.97 2 132 0.76 132 0.88 3 203 0.95 203 0.73 4 243 0.66 39 1 391 0.82 183 0.95 248 0.97 2 261 0.80 300 0.84 43 1 144 0.72 125 0.96 2 3 4

Case 31, Corrected Case 31, Uncorrected

slide-57
SLIDE 57

Adverse Environment Rotor Test Stand The Vertical Lift Research Center of Excellence

Agenda

  • Background/Motivation
  • ARISP Rotor Icing Model
  • Understanding AERTS
  • ARISP Correlations to AERTS Experiments
  • Conclusions & Recommendations for Future Work
slide-58
SLIDE 58

Adverse Environment Rotor Test Stand The Vertical Lift Research Center of Excellence

Conclusions

  • ARISP Model

– Demonstrated the ability of model based upon LEWICE to predict ice accretions

  • n rotor blades

– Additional features integrated into model include torque degradation and shedding – Model compared to published ice shapes, model scale & full scale

  • AERTS Facility

– Basic understanding of the chamber flowfield and particle trajectories

– Limitations established, especially for airfoil shapes

  • Experimental Correlations

– Shape: Generally good, overpredicted accretions at tip – Impingement Limits: Within 20% of predicted values – Torque: Using Bragg’s correlations, most test cases were within 20% of predicted values – Shedding: Further work required – Test conditions need to be better quantified for proper modeling

slide-59
SLIDE 59

Adverse Environment Rotor Test Stand The Vertical Lift Research Center of Excellence

Future Work

  • ARISP

– Ice Accretion

  • CF effects on ice accretion - LWC variation
  • Tip flowfield quantification

– Shedding

  • Shear adhesion strength test points
  • Tensile strength validation
  • More shedding test points
  • Non-square tip shapes
  • Trajectory analysis of shed ice
  • AERTS

– Icing Condition Monitoring

  • Temperature Control – current system limited
  • MVD Sensor – currently not measured
  • LWC Sensor – currently calculated experimentally

– Blades

  • Improved blade tracking/balance system
slide-60
SLIDE 60

Adverse Environment Rotor Test Stand The Vertical Lift Research Center of Excellence

Thank You Sponsors/Donors Questions?

slide-61
SLIDE 61

Adverse Environment Rotor Test Stand The Vertical Lift Research Center of Excellence

Backup

slide-62
SLIDE 62

Adverse Environment Rotor Test Stand The Vertical Lift Research Center of Excellence

800 RPM Velocity Contours

Nozzle Rings

NACA 0015 Rotor 7.75’ diameter 800 RPM Θo = 2.5°

slide-63
SLIDE 63

Adverse Environment Rotor Test Stand The Vertical Lift Research Center of Excellence

1000 RPM Velocity Contours

Nozzle Rings

NACA 0015 Rotor 7.75’ diameter 1000 RPM Θo = 2.5°

slide-64
SLIDE 64

Adverse Environment Rotor Test Stand The Vertical Lift Research Center of Excellence

800 RPM 20 µm Trajectories

slide-65
SLIDE 65

Adverse Environment Rotor Test Stand The Vertical Lift Research Center of Excellence

1000 RPM 20 µm Trajectories