agenda
play

agenda 4.00 introduction (Tim Dyson) 4.10 Beyond (Nick Rappolt) - PowerPoint PPT Presentation

109 MILLION REVENUES (FY 2015) 1,255 16 15 AVERAGE STAFF WORLDWIDE COUNTRIES* BRANDS* Half year to Jul 2015 unless shown, * Jan 2016 LONDON 28 70 + 65 % % HEAD OFFICE SAN FRANCISCO CLIENTS WITH OVER 1$M OF REVENUES FROM TECH CLIENTS


  1. £109 MILLION REVENUES (FY 2015) 1,255 16 15 AVERAGE STAFF WORLDWIDE COUNTRIES* BRANDS* Half year to Jul 2015 unless shown, * Jan 2016 LONDON 28 70 + 65 % % HEAD OFFICE SAN FRANCISCO CLIENTS WITH OVER 1$M OF REVENUES FROM TECH CLIENTS REVENUES (AT JULY 2015) OPERATIONAL CENTRE REVENUES FROM US 
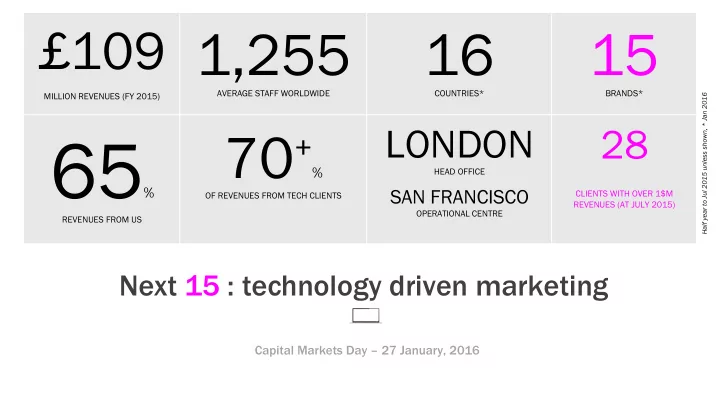
Next 15 : technology driven marketing Capital Markets Day – 27 January, 2016 Next Fifteen investor/ analyst event – 27.1.16

  2. agenda • 4.00 introduction (Tim Dyson) • 4.10 Beyond (Nick Rappolt) • 4.40 Morar (Roger Perowne) • 5.10 coffee break • 5.20 Agent3 (Clive Armitage) • 5.50 closing remarks (Tim Dyson) • 6.00 drinks Slide 2 Next Fifteen investor/ analyst event – 27.1.16

  3. today’s industry • creativity and content drive campaigns • data used like a drunk uses a lamppost … for support rather than illumination. • traditional channels such as TV and print still used to lead the campaigns • social used mainly to amplify traditional channel awareness • digital assets created to support programs Slide 3 Next Fifteen investor/ analyst event – 27.1.16

  4. today’s agency • advertising lead • CCO is king • Media spend is critical to business model • technology is outsourced • planners are focused on media Slide 4 Next Fifteen investor/ analyst event – 27.1.16

  5. old: creative/content > technology > data Slide 5 Next Fifteen investor/ analyst event – 27.1.16

  6. the new model • data used to define and refine campaigns • technology platforms are the starting point to campaigns - mobile first • technology is the key to unified marketing • hyper local and real time are the new norm. Global = general = old school Slide 6 Next Fifteen investor/ analyst event – 27.1.16

  7. new agency model • technology : Adobe, salesforce, FB, Google • data : analytics, planning, insight and campaign modeling • content : creative, technology creative, optimization, connected, measurable Slide 7 Next Fifteen investor/ analyst event – 27.1.16

  8. new: technology & data > creative/content Slide 8 Next Fifteen investor/ analyst event – 27.1.16

  9. new: technology & data > creative/content technology driven marketing Slide 9 Next Fifteen investor/ analyst event – 27.1.16

  10. Next 15 • building technology and data science into every business • focus on high growth clients and markets being digital • less worried about being big than Slide 10 Next Fifteen investor/ analyst event – 27.1.16

  11. Next 15 Technology: Data: Content: Agent 3 Morar OutCast Beyond M Booth bDA Text 100 Connections Media Bite ODD Story Encore Vrge Lexis Blueshirt Slide 11 Next Fifteen investor/ analyst event – 27.1.16

  12. top 20 customers Data as at Decl 2015 Next Fifteen investor/ analyst event – 27.1.16 Slide 12

  13. Next 15 : growth cycle growth ma marke ket inv nvestme ment nt right ht scale le v via u us/ phase ins nsight ht sizing ng uk uk la launc nch h where who how when growth question current assets = talent first approach speed to market and current assets = market opportunities talent incentivisation = market opportunities business our approach NFC group Encore, M Beyond, Morar/ Agent3, examples Booth, Encore Agent3, ODD Redshift Beyond, Morar Slide 13 Next Fifteen investor/ analyst event – 27.1.16

  14. our comparative advantages • California presence gives us preferred insight into digital innovation CALIFORNIA PRESENCE • tech client base has brought key relationships with digital thought- leaders TECH CORPORAT • our entrepreneurial culture has CLIENT E CULTURE helped to incubate new brands BIAS successfully Next Fifteen investor/ analyst event – 27.1.16 Slide 14

  15. our growth 2010 - 2015 GOOGLE/ 64 % 99 % 82 % ALPHABET LARGEST CLIENT 2015, NOT A MATERIAL REVENUE GROWTH 2010/15 CLIENT IN 2010 INCREASE IN EBITDA 2010/2015 EPS GROWTH 2010/15 44 % 10.5 % 11 % 38 % INCREASE IN STAFF 2010/15 ADJ ROCE POST TAX 2015 MINIMUM ANNUAL ORGANIC INCREASE IN EBITDA GROWTH IN US SINCE 2012 PER STAFF 2010/15 12 months to July 2015 vs 12 months to Jul 2010 except where stated, Slide 15 Next Fifteen investor/ analyst event – 27.1.16

  16. thanks 16 Next Fifteen investor/ analyst event – 27.1.16

Download Presentation
Download Policy: The content available on the website is offered to you 'AS IS' for your personal information and use only. It cannot be commercialized, licensed, or distributed on other websites without prior consent from the author. To download a presentation, simply click this link. If you encounter any difficulties during the download process, it's possible that the publisher has removed the file from their server.

Recommend


More recommend