
SLIDE 1
7/21/2011
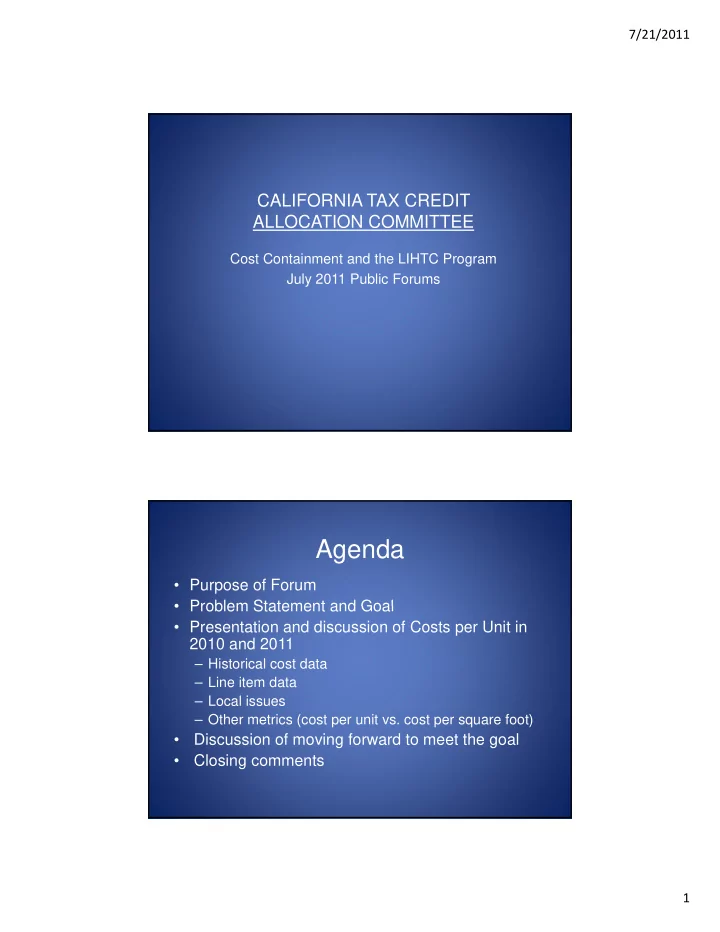
CALIFORNIA TAX CREDIT ALLOCATION COMMITTEE ALLOCATION COMMITTEE
Cost Containment and the LIHTC Program July 2011 Public Forums
Agenda
- Purpose of Forum
- Problem Statement and Goal
- Problem Statement and Goal
- Presentation and discussion of Costs per Unit in
2010 and 2011
– Historical cost data – Line item data – Local issues – Other metrics (cost per unit vs. cost per square foot)
- Discussion of moving forward to meet the goal
- Closing comments