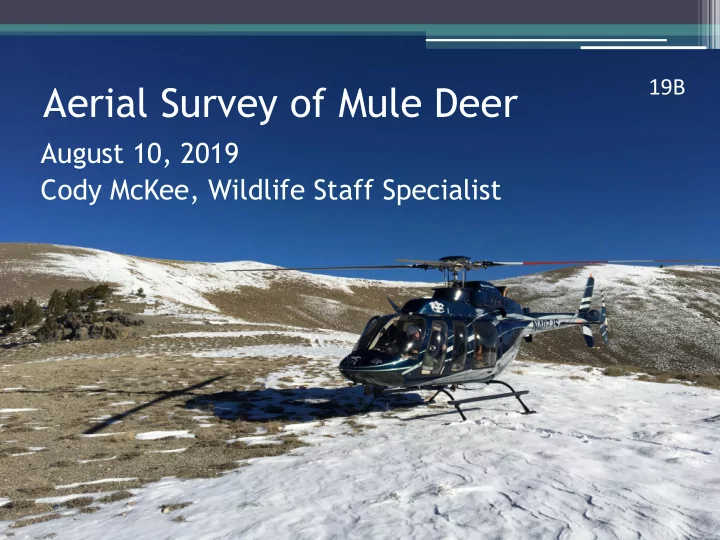

19B Aerial Survey of Mule Deer August 10, 2019 Cody McKee, Wildlife Staff Specialist
Why Survey? • We collect age and sex data of mule deer herds (i.e., fawn and buck ratios) to inform and calibrate population models. • Secondarily, provides an opportunity to evaluate landscape changes at a large-scale like effects of pinyon-juniper removal or wildfire recovery.
When do we survey? • We fly twice a year: ▫ Post-hunt (fall) ▫ Post-winter (spring) • Post-hunt flights should be flown near the peak of the rut. However, this is not always possible due migratory behavior, number of areas flown, seasonal time constraints, etc. • Spring flights are intended to estimate over-winter fawn loss. Spring flights should occur when deer herds are recovering from winter. Resulting data provides an estimate of fawns expected to be recruited into the adult population.
How do we survey? Surveys are primarily conducted by helicopter using one of two techniques: 1) Directed search 2) Sample-based (aka polygon)
What is a Directed Search Aerial Survey?
Classified 500 deer Bucks/100 Does: 27 Fawns/100 Does: 45
What is a Sample- Based Aerial Survey?
Objective of a Sample-Based Survey Optimize timing and duration of aerial surveys to collect the best data for input into population models and, ultimately, to provide informed harvest recommendations.
Questions • What is the optimal “count” needed for ratios and confidence intervals to stabilize? • Will this allow us to fly more unit groups closer to the peak-of-the-rut? • Can data be collected in a method that obtains accurate ratios with precision allowing for valid statistical inference about the population?
Stabilization – Ruby Mountains (2014) percent total 90% 90% sampled count fawn ratio CI buck ratio CI 1 43 0.48 0.291 0.24 0.278 2 81 0.49 0.225 0.23 0.183 5 273 0.68 0.147 0.27 0.094 10 556 0.63 0.099 0.29 0.069 20 1188 0.64 0.064 0.25 0.043 30 1877 0.63 0.047 0.28 0.035 40 2628 0.60 0.042 0.28 0.031 50 3039 0.60 0.037 0.30 0.030 60 3567 0.59 0.032 0.30 0.026 70 4391 0.60 0.030 0.28 0.022 80 4860 0.59 0.029 0.30 0.024 90 5636 0.58 0.026 0.29 0.021 100 6233 0.59 0.026 0.29 0.020
Stabilization – Ruby Mountains Random Subsampling of Area 10 Survey Data (2014) fawn ratio buck ratio 1.00 0.90 0.80 0.70 ratio ( r ) 0.60 0.50 0.40 0.30 0.20 0.10 0.00 1 2 5 10 20 30 40 50 60 70 80 90 100 Sampled (%)
Sample-Based Survey • Stratify deer densities across mountain ranges into “bins” of high, medium, and low density using historical survey data (Keegan et al. 2011). • Randomly select plots to be surveyed from each stratification to obtain representative sample of the entire area
Stratification – Ruby Mountains
Subsample Analysis – Ruby Mountains • Units 101-103 & 109 were divided into 67 plots • Analyzed: ▫ Post-season survey datasets from: 2005-2007, 2010-2012, 2014 ▫ Simulated past survey results by randomly selecting polygons and extracting survey data: Sub1 – data extracted from 28% of plots Sub2 – data extracted from 30% of plots Sub3 – data extracted from 22% of plots Sub4 – data extracted from 36% of plots Sub5 - data extracted from 43% of plots
Subsample Analysis – Ruby Mountains Comparison of Observed Fawn Ratios 1.000 0.900 0.800 0.700 2005 0.600 2006 2007 0.500 2010 2011 0.400 2012 0.300 2014 0.200 0.100 0.000 complete sub1 sub2 sub3 sub4 sub5
Subsample Analysis – Ruby Mountains Comparison of Observed Buck Ratios 1.000 0.900 0.800 0.700 2005 2006 0.600 2007 0.500 2010 2011 0.400 2012 0.300 2014 0.200 0.100 0.000 complete sub1 sub2 sub3 sub4 sub5
Implementing a Sample-Based Survey – Ruby Mountains Directed-Hybrid Sample-Based Directed-Hybrid Sample-Based Fawn Ratio Fawn Ratio Buck Ratio Buck Ratio Year 2017 47.9 48.4 38.3 37.6 2018 47.3 47.9 37.1 37.2 Directed-Hybrid Sample-Based Sample Size Sample Size Year 2017 4546 1810 40% 2018 4536 2183 48%
Summary • The Department conducts two aerial surveys during the survey season (post-hunt, & spring). • Sex and age ratios are used to inform population models. • Sample-based surveys may help us better schedule flights during the best times to detect deer and we are strategically integrating these techniques into more areas of Nevada.
Recommend
More recommend