
SLIDE 1
Addressing dietary inequalities
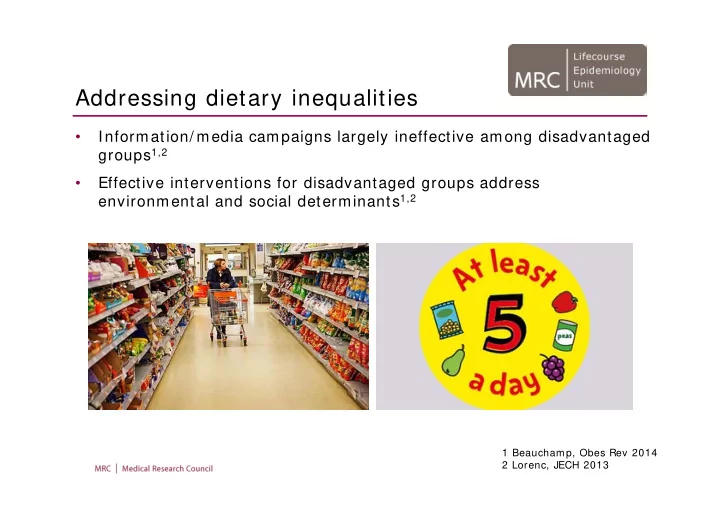
- Information/ media campaigns largely ineffective among disadvantaged
groups1,2
- Effective interventions for disadvantaged groups address
environmental and social determinants1,2
1 Beauchamp, Obes Rev 2014 2 Lorenc, JECH 2013