
SLIDE 1
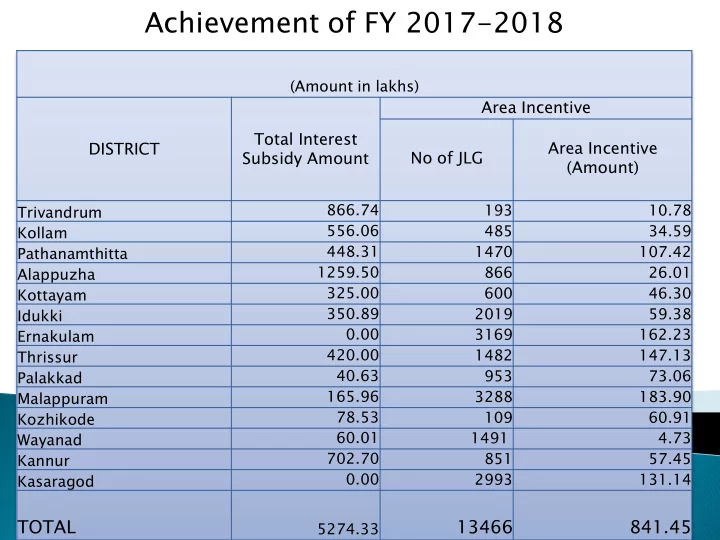
Achievement of FY 2017-2018
(Amount in lakhs)
DISTRICT Total Interest Subsidy Amount Area Incentive No of JLG Area Incentive (Amount)
Trivandrum 866.74 193 10.78 Kollam 556.06 485 34.59 Pathanamthitta 448.31 1470 107.42 Alappuzha 1259.50 866 26.01 Kottayam 325.00 600 46.30 Idukki 350.89 2019 59.38 Ernakulam 0.00 3169 162.23 Thrissur 420.00 1482 147.13 Palakkad 40.63 953 73.06 Malappuram 165.96 3288 183.90 Kozhikode 78.53 109 60.91 Wayanad 60.01 1491 4.73 Kannur 702.70 851 57.45 Kasaragod 0.00 2993 131.14
TOTAL
5274.33
13466 841.45