abstract session d1 lipkin award finalist session
play

Abstract Session D1: Lipkin Award Finalist Session Moderators: - PDF document

Abstract Session D1: Lipkin Award Finalist Session Moderators: Eugene C. Rich, MD and William M. Tierney, MD STATIN PRESCRIBING FOR PRIMARY PREVENTION: WHAT MIGHT THE 2013 ACC/AHA GUIDELINES ACHIEVE? Harb Harb 1 ; Michael B. Rothberg 1 ; Brian


  1. Abstract Session D1: Lipkin Award Finalist Session Moderators: Eugene C. Rich, MD and William M. Tierney, MD STATIN PRESCRIBING FOR PRIMARY PREVENTION: WHAT MIGHT THE 2013 ACC/AHA GUIDELINES ACHIEVE? Harb Harb 1 ; Michael B. Rothberg 1 ; Brian Wells 2 ; Bo Hu 2 . 1 Cleveland Clinic, Cleveland, OH; 2 Cleveland Clinic, Cleveland, OH. (Tracking ID #1937737) BACKGROUND: The Adult Treatment Panel III guidelines for cholesterol testing and treatment in primary prevention were based on cardiovascular risk factors and LDL cholesterol targets. In contrast, the new American College of Cardiology/American Heart Association (ACC/AHA) 2013 guideline focuses exclusively on cardiovascular risk, with statins recommended for all patients with a 10-year risk of >7.5% using a new population-based risk calculator. One concern is that the ACC/AHA guidelines may lead to initiation of statin therapy for more patients, including many who would have been considered to be lower risk by the earlier criteria. In contrast, the previous focus on LDL may have led to overprescribing for patients with high LDLs and low risk, or underprescribing for those with low LDLs but high risk. The objective of this study is to quantify the potential change in statin prescribing patterns using the ACC/AHA guidelines compared to current practice for patients without CHD equivalents. METHODS: We conducted a retrospective cross sectional study of patients aged between 30 to 75 years old who received a first outpatient primary care visit at the Cleveland Clinic between January 1, 2005 and December 31, 2012. Patients with incomplete data, 
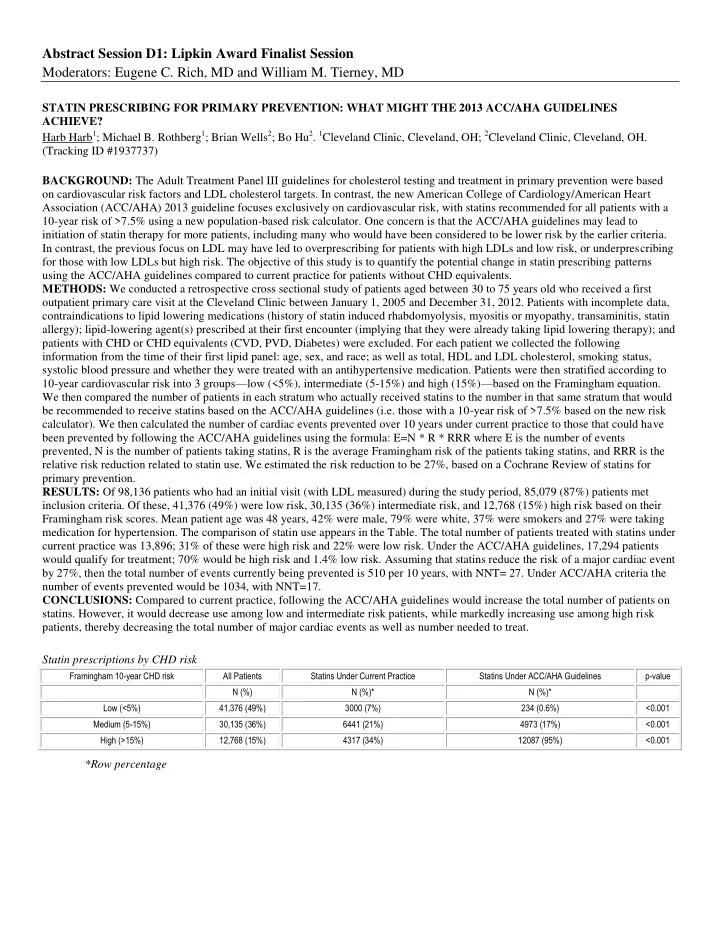
contraindications to lipid lowering medications (history of statin induced rhabdomyolysis, myositis or myopathy, transaminitis, statin allergy); lipid-lowering agent(s) prescribed at their first encounter (implying that they were already taking lipid lowering therapy); and patients with CHD or CHD equivalents (CVD, PVD, Diabetes) were excluded. For each patient we collected the following information from the time of their first lipid panel: age, sex, and race; as well as total, HDL and LDL cholesterol, smoking status, systolic blood pressure and whether they were treated with an antihypertensive medication. Patients were then stratified according to 10-year cardiovascular risk into 3 groups — low (<5%), intermediate (5-15%) and high (15%) — based on the Framingham equation. We then compared the number of patients in each stratum who actually received statins to the number in that same stratum that would be recommended to receive statins based on the ACC/AHA guidelines (i.e. those with a 10-year risk of >7.5% based on the new risk calculator). We then calculated the number of cardiac events prevented over 10 years under current practice to those that could have been prevented by following the ACC/AHA guidelines using the formula: E=N * R * RRR where E is the number of events prevented, N is the number of patients taking statins, R is the average Framingham risk of the patients taking statins, and RRR is the relative risk reduction related to statin use. We estimated the risk reduction to be 27%, based on a Cochrane Review of statins for primary prevention. RESULTS: Of 98,136 patients who had an initial visit (with LDL measured) during the study period, 85,079 (87%) patients met inclusion criteria. Of these, 41,376 (49%) were low risk, 30,135 (36%) intermediate risk, and 12,768 (15%) high risk based on their Framingham risk scores. Mean patient age was 48 years, 42% were male, 79% were white, 37% were smokers and 27% were taking medication for hypertension. The comparison of statin use appears in the Table. The total number of patients treated with statins under current practice was 13,896; 31% of these were high risk and 22% were low risk. Under the ACC/AHA guidelines, 17,294 patients would qualify for treatment; 70% would be high risk and 1.4% low risk. Assuming that statins reduce the risk of a major cardiac event by 27%, then the total number of events currently being prevented is 510 per 10 years, with NNT= 27. Under ACC/AHA criteria the number of events prevented would be 1034, with NNT=17. CONCLUSIONS: Compared to current practice, following the ACC/AHA guidelines would increase the total number of patients on statins. However, it would decrease use among low and intermediate risk patients, while markedly increasing use among high risk patients, thereby decreasing the total number of major cardiac events as well as number needed to treat. Statin prescriptions by CHD risk Framingham 10-year CHD risk All Patients Statins Under Current Practice Statins Under ACC/AHA Guidelines p-value N (%) N (%)* N (%)* Low (<5%) 41,376 (49%) 3000 (7%) 234 (0.6%) <0.001 Medium (5-15%) 30,135 (36%) 6441 (21%) 4973 (17%) <0.001 High (>15%) 12,768 (15%) 4317 (34%) 12087 (95%) <0.001 *Row percentage

  2. INTERHOSPITAL TRANSFERS: PATIENT CHARACTERISTICS AND OUTCOMES Cecelia N. Theobald 1,2 ; Stephan Russ 3 ; Jesse Ehrenfeld 4 ; Sunil Kripalani 2 . 1 VA Tennessee Valley Healthcare System, Nashville, TN; 2 Vanderbilt University, Nashville, TN; 3 Vanderbilt University, Nashville, TN; 4 Vanderbilt University, Nashville, TN. (Tracking ID #1939070) BACKGROUND: The transfer of inpatients between hospitals is often necessitated by differential expertise and capacity among facilities. At some institutions, interhospital transfers constitute nearly 20% of all inpatient admissions and there is concern they may experience poorer outcomes. Much of the literature to date has examined small subpopulations of interhospital transfers (such as ICU, trauma, and burn patients) without evaluating the characteristics of transfer patients as a population. Our objective was to compare the arrival characteristics and outcomes of interhospital transfer patients with those of patients directly admitted to a large academic medical center. METHODS: We conducted a retrospective cohort study of patients transferred into an academic medical center and compared these with patients directly admitted during an eighteen month period. Patients were excluded if they were transferred into the Emergency Department, Labor and Delivery, or admitted to burn or trauma services. Admission characteristics studied included demographics, site of admission (ICU vs. non-ICU), severity of illness (measured using the modified Elixhauser comorbidity index, range of possible scores -14 to 60), admitting service, and time of arrival. Outcome measures included length of stay, ICU length of stay, in- hospital mortality, and timeliness of initial inpatient care. Transfer patients were compared with non-transfer patients using simple univariate analysis. RESULTS: Transferred and non-transferred patients had similar rates of ICU admission (46.5% vs. 47.4%, p = 0.53) but transferred patients had higher severity of illness (mean modified Elixhauser score 12.0 vs. 9.3, p < 0.001). Nearly two thirds, or 65% of interhospital transfers arrived during overnight hours (6PM to 7AM), vs. only 56.2% of non-transferred patients (p < 0.001). Transferred patients waited on average 18 minutes longer for admission orders (p < 0.001) and 15 minutes longer for non-PRN medication orders (p < 0.001). Furthermore, transferred patients experienced significantly longer length of stay (6.0 vs. 3.1 days, p < 0.001) and ICU length of stay (4.4 days vs. 2.5 days, p < 0.001). Finally, transferred patients had over twice the in- hospital mortality of non-transferred patients (10.9% vs. 4.9%, p < 0.001). CONCLUSIONS: Interhospital transfer patients as a population have an increased severity of illness and experience longer length of stay, delays in initial inpatient care, and higher in-hospital mortality when compared with non-transferred patients. Hospitals may want to focus specific resources on this unique high-risk population. Table: Comparison of transfer and non-transfer population Characteristic Transfers (n=1715) Non-transfers (n=6176) p value Age, mean (SD) 55.3 (16.6) 57.7 (16.9) <0.001 1 Male % 48.6% 56.3% <0.001 2 ICU admission (%) 46.5% 47.4% 0.53 2 Modified Elixhauser index, mean (SD) 12.0 (10.5) 9.3 (9.6) <0.001 1 Service Medicine Surgery Neurology OB/Gyn 55.7% 34.1% 8.8% 1.5% 63.6% 29.7% 6.0% 0.6% <0.001 2 Time of arrival Day shift (07:00 - 17:59) Night shift (18:00 - 06:59) 35.2% 64.8% 43.8% 56.2% <0.001 2 Time to in minutes, median (IQR) Admission order entry Non PRN 46 (19 - 90) 28 (12 - 61) 199 28 (3.5 - 70) 13 (0 - 41) 190.5 < 0.001 3 < 0.001 3 medication order Antibiotic order (81 - 505) (35 - 615) 0.0011 3 Length of stay, median (IQR) Total hospital ICU 6.0 (3.2 - 11.3) 4.4 (2.3 - 8.9) 3.1 (1.8 - 6.3) 2.5 (1.3 - 5.0) < 0.001 3 < 0.001 3 In-hospital mortality % 10.9% 4.9% <0.001 2 Statistical tests used: 1 T-test 2 Chi-square 3 Wilcoxon rank-sum

Download Presentation
Download Policy: The content available on the website is offered to you 'AS IS' for your personal information and use only. It cannot be commercialized, licensed, or distributed on other websites without prior consent from the author. To download a presentation, simply click this link. If you encounter any difficulties during the download process, it's possible that the publisher has removed the file from their server.

Recommend


More recommend