a global compilation of glacial 10 be and 26 al exposure
play

A global compilation of glacial 10 Be and 26 Al exposure age data - PowerPoint PPT Presentation

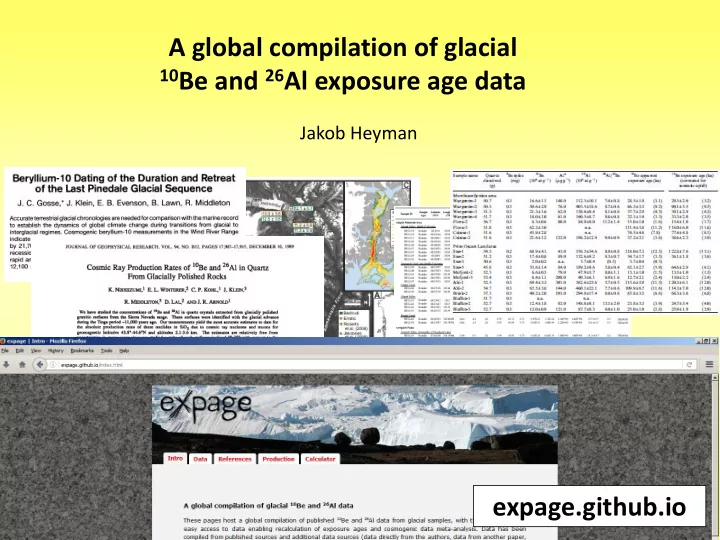
A global compilation of glacial 10 Be and 26 Al exposure age data Jakob Heyman expage.github.io Outline Motivation The compilation Analysis - Scatter / clustering - Well-clustered ages - 26 Al / 10 Be burial dating - How many samples to


  1. A global compilation of glacial 10 Be and 26 Al exposure age data Jakob Heyman expage.github.io

  2. Outline Motivation The compilation Analysis - Scatter / clustering - Well-clustered ages - 26 Al / 10 Be burial dating - How many samples to collect?

  3. Motivation 1 Enable easy recalculation of glacial exposure ages

  4. Motivation 2 Enable meta-analysis using a comprehensive dataset Heyman et al. (2016)

  5. Included data Compilation work 1. Primary publication 2. Sample type 3. Surface ID • Searching �Journals, Google Scholar, reference lists…� 4. Group ID 5. Sample name • Copy-paste, copy-paste, copy- paste… 6. Latitude 7. Longitude • Correcting mistakes 8. Elevation • Emails 9. Sample thickness For recalculation 10. Sample density • Assumptions 11. Shielding 12. 10 Be concentration • Recalculation 13. 10 Be uncertainty 14. 10 Be standard 15. 26 Al concentration 16. 26 Al uncertainty 17. 26 Al standard 18. Sampling year 19. Publ 10 Be exp age 20. Publ 10 Be exp age unc 21. Publ 26 Al exp age 22. Publ 26 Al exp age unc Recalculated ages 23. Recalc 10 Be exp age 24. 10 Be external unc DATA COMMENTS 25. 10 Be internal unc 26. Recalc 26 Al exp age 27. 26 Al external unc 28. 26 Al internal unc 29. Extra publication

  6. Recalculation Balco et al. (2008) Lifton et al. (2014) Phillips et al. (2016) Calibration studies 2009-2016 expage.github.io/calculator Marrero et al. (2016)

  7. 10 Be: 11 093 measurements Data from 527 26 Al : 1 683 measurements primary publications 1200 Number of measurements Be-10 measurements 1000 Al-26 measurements 800 600 400 200 0 1989 1990 1991 1992 1993 1994 1995 1996 1997 1998 1999 2000 2001 2002 2003 2004 2005 2006 2007 2008 2009 2010 2011 2012 2013 2014 2015 2016 Publication year 940 cobble / pebbles / sediments samples 1815 bedrock samples 8399 boulder samples

  8. Spatial distribution Greenland: 663 Asia: 2543 N America: Europe: 2205 2463 Africa: 16 Antarctica: 1113 S America: 1340 Oceania: 811

  9. Individual All samples ordered in groups groups One group = one deglaciation age

  10. Group exposure age clustering Scattered: Chi-square analysis P-value < 0.05 Well-clustered: Chi-square analysis P-value > 0.05 Outlier rejection: max 1/3 still requiring at least 3 samples 20 18 Exposure age (ka) 16 14 12 Well-clustered Well-clustered after 10 Scattered outlier rejection

  11. How common is well-clustered data? 80 No outliers 70 Well-clustered groups (%) Outliers 60 50 40 30 20 10 0

  12. Clustering against mean age

  13. Clustering/scatter against mean age

  14. Clustering against mean age

  15. Well-clustered group ages

  16. Well-clustered group ages

  17. ICE SHEETS Forbidden zone: 6% Simple exposure: 47% Clear burial: 47%

  18. ALPINE Forbidden zone: 6% Simple exposure: 65% Clear burial: 29%

  19. How many samples per site?

  20. How many samples per publication? 35 (Google Scholar 3-5 June 2016) 30 25 Citations per year 20 15 10 5 0 0 20 40 60 80 100 Numer of samples

  21. expage.github.io

  22. Thank you!

Download Presentation
Download Policy: The content available on the website is offered to you 'AS IS' for your personal information and use only. It cannot be commercialized, licensed, or distributed on other websites without prior consent from the author. To download a presentation, simply click this link. If you encounter any difficulties during the download process, it's possible that the publisher has removed the file from their server.

Recommend


More recommend