
SLIDE 1
A Glo lobal l Equit ity y Str trategy egy focu cuse sed on - - PowerPoint PPT Presentation
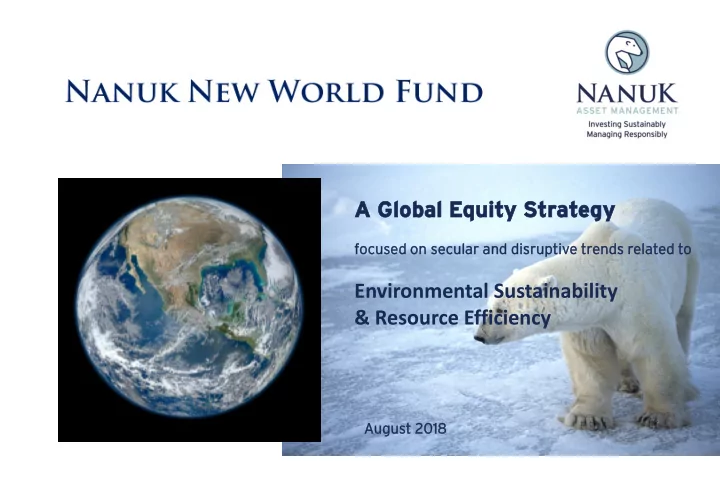
A Glo lobal l Equit ity y Str trategy egy focu cuse sed on se secu cular lar and disrupti ptive e trends relat ated ed to Environmental Sustainability & Resource Efficiency August st 2018 Agricultural Industrial Digital
Source: W. Michael Cox, Southern Methodist University, O’Neil Center for Global Markets Annual Report 2015-16, Nanuk extrapolation post 2015
Solar is now the cheapest st source of new electric icit ity y supply ly globally lly 24hr electr tric icit ity y from m solar and batteries ies is now w competit itive ive with h grid power Autonomo nomous us cars s are drivin ving on our roads s today y (and availabl ilable for hire) 3D printi ting ng of metal l parts s is already y in comme mercia ial l use Off ffshor shore wind power is now as cheap as new w coal l fired power Mass ss market t electr tric ic vehic icles les are availabl ilable today Collabor llaborati tive ve robots ts are already y cheaper than develop loped countr try y labou
ts Drones nes are approved
mercia ial l use Roboti tic Medical l Equip ipment nt
Solar PV Equipment & Projects Automotive ADAS Connectors EV & ADAS Components Clean Energy Buses Collaborative Robots Carbon Fibre Industrial & Auto Semiconductors Metal 3D Printing Lithium Battery Chemicals Commercial Drones Composite Materials & Moulds Wind Farms Waste Management Batteries & Environmental Products Residential Solar Leasing Energy Efficiency Project Financing Industrial Batteries Wind Turbines High Speed Rail Aquaculture Biomaterials Energy Infrastructure & Automation Industrial Design Software
Source: Nanuk, as at 30 June 2018
50 100 150 200 250 300 350 400 450
MSCI All Country World Total Return Index (AUD) FTSE Environmental Opportunities All-Share Total Return Index (AUD) NANUK New World Strategy (AUD)
Sources: Nanuk, Bloomberg, FTSE Russell, $A, annualised returns. The Nanuk “Strategy” performance constitutes the following: (1) Nanuk New World Fund since launch
2015) . NB: Past performance is not an indicator of future performance. Index Return
(AUD, 31 Jul 2018)
1 Yr 15 Yrs
FTSE EOAS 13.1% 10.9% MSCI ACWI 15.0% 7.5% Outperformance
3.4%
Note: NNWF inception date 2 November 2015; AUD Net of fees. Past performance is not indicative of future performance.
Nanuk New World Fund FTSE EOAS (benchmark) Bloomberg World Index Number of Stocks 71 515 5,118 Weighted Average Market Cap (US$bn) 36.5 35.3 122.4 Median Market Cap (US$bn) 12.4 2.9 4.2 PE Ratio (FY1) 15.4 18.0 15.3 ROE 21.2% 16.0% 16.9% LT Debt to Capital 29.4% 32.0% 32.1% Forecast 3-5yr EPS growth 11.8% 11.1% 12.6% Dividend Yield 1.8% 2.0% 2.3% Turnover (trailing 12 mths) 52.9% Predicted Volatility (USD returns) 10.9% 11.1% 9.9% vs EOAS vs Bloomberg World Predicted Tracking Error 4.3% 4.6% Downside / Upside Capture (since inception) 94% / 98% 90% / 100%
Sources: Bloomberg, FactSet & Nanuk, as at 31 July 2018
Name Nanuk New World Fund Type Global equity Legal l Structure cture Registered Australian unit trust Trust stee ee EQT Responsible Entity Services Limited Inves estm tment ent Manager er Nanuk Asset Management Pty Limited Cust stod
ian/ n/Admini inistra rator tor RBC Investor Services Trust Descri cripti tion
The fund holds a diversified portfolio of global equities in companies potentially benefiting from the broad themes of resource scarcity and environmental sustainability Inves estm tment ent Objecti ective To outperform global equities over the longer term Perfor
nce e Benc nchm hmark rk FTSE Environmental Opportunities All Share Total Return Index (AUD) Sugges este ted Time e Period
Suggested minimum investment timeframe of 5 years Fund Currency ency Australian Dollars Curre renc ncy Hedging ing Direct foreign currency exposure typically remains unhedged. The Fund can use foreign exchange contracts to facilitate settlement of stock purchases and to mitigate currency risk on specific investments within the portfolio Inves estm tments ents Listed equities* 80-100% (typically > 95%); Cash 0-20% *may include derivatives such as total return swaps to gain exposure to the underlying equity Number r of Stocks cks 50 – 100 (typically 60-70) Distri tribution utions Taxable income distributed annually, reinvestment election available Fees s & Expense enses s Management fee 80bps, Administration fee 40 bps. Total fees capped at 120bps. Applicat cations ions & Redempti tions
Daily Minim imum um Inves estment ent Direct investment - $50,000 (Wholesale Investors only) ; Platform investment – platform minimum Platform
ss BT (Wrap, Panorama, Asgard), Hub24, IOOF Pursuit, Macquarie Wrap, Netwealth, OneVue, Powerwrap