A Framework for Urban Growing Influence in Western Water Colorado - - PowerPoint PPT Presentation

a framework for
SMART_READER_LITE
LIVE PREVIEW

A Framework for Urban Growing Influence in Western Water Colorado - - PowerPoint PPT Presentation

A Framework for Urban Growing Influence in Western Water Colorado Landscape : Largest Demand, Most Potential Community Assets Water Resources Review Committee, Colorado Legislature, Water Budgets : D August 2014 R Paul W. Lander, PhD, ASLA,


slide-1
SLIDE 1

Urban Growing Influence in Western Water Landscape : Largest Demand, Most Potential

Community Assets

Water Budgets : D

R

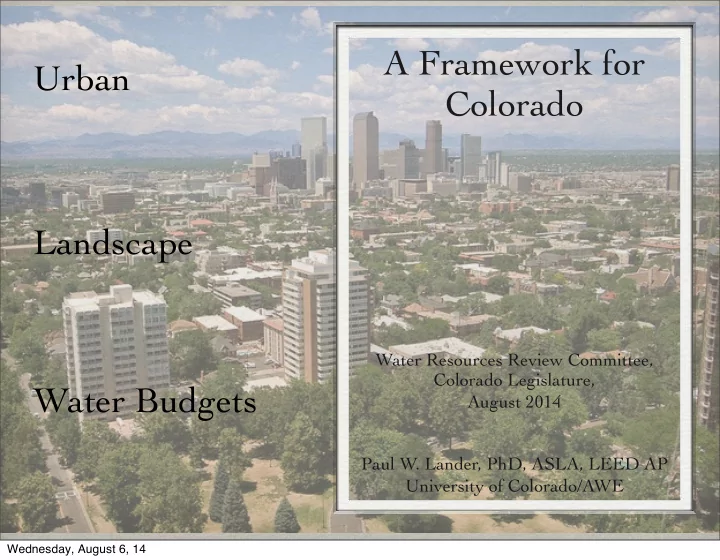
A Framework for Colorado

Water Resources Review Committee, Colorado Legislature, August 2014 Paul W. Lander, PhD, ASLA, LEED AP University of Colorado/AWE

Wednesday, August 6, 14

slide-2
SLIDE 2

Urban : Growing Influence in Western Water Landscape : Largest Demand, Most Potential

Community Assets

Water Budgets : D

R

Wednesday, August 6, 14

slide-3
SLIDE 3

Urban : Growing Influence in Western Water Landscape : Largest Demand, Most Potential

Community Assets

Water Budgets : D

R

Wednesday, August 6, 14

slide-4
SLIDE 4

Urban : Growing Influence in Western Water Landscape : Largest Demand, Most Potential

Community Assets

Water Budgets : Definable Goals,

Measurable Results

Wednesday, August 6, 14

slide-5
SLIDE 5

the Future = Re-Allocation

$14K/unit >

Wednesday, August 6, 14

slide-6
SLIDE 6

City of Boulder, 1994-1996

Cities Usage Patterns: ~95% Treated Drinking Water Peak Demand from Outdoor Use Residential ~ 65% of Total Demand

Wednesday, August 6, 14

slide-7
SLIDE 7

City of Boulder, 1994-1996

Cities Usage Patterns: ~95% Treated Drinking Water Peak Demand from Outdoor Use Residential ~ 65% of Total Demand

100% Drinking Water (EPA Standards) <5% consumed

Wednesday, August 6, 14

slide-8
SLIDE 8

City of Boulder, 1994-1996

Cities Usage Patterns: ~95% Treated Drinking Water Peak Demand from Outdoor Use Residential ~ 65% of Total Demand

100% Drinking Water (EPA Standards) <5% consumed

Wednesday, August 6, 14

slide-9
SLIDE 9

Green Infrastructure Important, and We Can Do Better 55% average measured efficiency,

CRC Slow the Flow 2004-2013

Wednesday, August 6, 14

slide-10
SLIDE 10

Response?

Wednesday, August 6, 14

slide-11
SLIDE 11

Response? Yes, a waste of water

Wednesday, August 6, 14

slide-12
SLIDE 12

Response? Yes, a waste of water

but, when we consider some of the costs? $500/af farmers ability to pay? $1000/af $5000/ af DW LS rebate? $10000/af $20,000/ af Southern Delivery Project $50,000+/af NV north pipe/Pr Waters

Kenny, in Colorado Water (CSU), 2010 ,and others

Wednesday, August 6, 14

slide-13
SLIDE 13

STATE OF COLORADO ^

 Data Tracking (minimum)

 By Customer Types  Monthly/Seasonal/Annually  By Water Supply Type

 Treated  Raw/Reuse/Reclaimed

 By Connection/GPCD

Definable Goals, Measurable Results

Wednesday, August 6, 14

slide-14
SLIDE 14

GIS & Customer Information Systems

  • M. Dickens ^

Veolia Water, CA Scott Winter ^ Colo Springs, CO influence ~ prosperity

Texas Water Development Board, Tech Note 12-01

State-wide measurement of landscape water use: Urban water use is increasing in the West, so without guidance, landscape water use will also increase.

Wednesday, August 6, 14

slide-15
SLIDE 15

Center Neighborhood Technology, 2010

Wednesday, August 6, 14

slide-16
SLIDE 16

Landscapes are valuable assets for many Colorado cities.

Denver Urban Forest Plan

Wednesday, August 6, 14

slide-17
SLIDE 17

Months: March - October ON TOP of indoor allocation

Outdoor Allocation 15 gal/sq.ft x LS sq.ft. (ET curve Mar-Oct) Water Budgets Explained WATER BUDGET Indoor (5000 gal/month) plus

  • 1. Calculate ^
  • 2. Allocate >

Wednesday, August 6, 14

slide-18
SLIDE 18

Water Budgets Explained

Boulder, CO $/1000 gallons (% of budget) Block 1 2.25 (3/4 base) 0% - 60% Block 2 $3.00 (“base rate") 61% - 100% Block 3 $6.00 (2 x base) 101% - 150% Block 4 $9.00 (3 x base) 151% - 200% Block 5 $15.00 (5 X base) > 200%

  • 3. Measure & Report
  • 4. Educate and Charge

Wednesday, August 6, 14

slide-19
SLIDE 19

circa 1970s circa 1990s circa 2000s

Rate Structure (’91) & Plant Material Selection Reduces Water Use Irvine Ranch, CA

Public LS ~1990-2010 Doubled Area while Total Use Increased <4% Avg Use Declined :3.5 AF/ac to 1.9 AF/ac Improved Water Quality with reduced dry weather runoff High Community Satisfaction Relatively Quick Implementation

Wednesday, August 6, 14

slide-20
SLIDE 20

circa 1970s circa 1990s circa 2000s

Rate Structure (’91) & Plant Material Selection Reduces Water Use Irvine Ranch, CA

Public LS ~1990-2010 Doubled Area while Total Use Increased <4% Avg Use Declined :3.5 AF/ac to 1.9 AF/ac Improved Water Quality with reduced dry weather runoff High Community Satisfaction Relatively Quick Implementation

Wednesday, August 6, 14

slide-21
SLIDE 21

Existing cities see major reductions in outdoor use with a Water Budget approach. Flexible and Fair.

Mayer et al, 2008. JAWWA.

City Water Use Reduction Irvine Ranch CA

37%

San Juan Capistrano CA

35%

Otay CA

20%

Centennial W & S CO

25%

Wednesday, August 6, 14

slide-22
SLIDE 22

Rethink Storage.... Green Water Matters

Brad Lancaster: Tucson, AZ > ^ Marcia Tatroe, Aurora, CO

Water in Biosphere (km3) Groundwater 4000.0 Freshwater Lakes 125.0 Soil Moisture 67.0 Rivers 1.2

after Wetzel, SUNYesf.edu 1 km3 ~ 264 Bg Wednesday, August 6, 14

slide-23
SLIDE 23

POLICY EVOLUTION : Prescription to Performance to Zero Water Prescription Many CO HOAs pre-2009: No buffalograss or Xeriscape allowed Sustainable Sites/ASLA (2009): reduce potable water use for irrigation by 50% from baseline EPA (2005): Turfgrass shall not exceed 40 percent of LS area Performance - Endorsing Water Budgets : GreenCO California Landscape Contractors Irrigation Association U.S. EPA 25+ Water Providers Zero Water/Offsets: Colorado Water Innovation Cluster AWE White Paper, September 2014

Wednesday, August 6, 14

slide-24
SLIDE 24

Action Avg Savings Time Frame Restrictions/Drought 10-15% Reactive Water Budgets 25-30% Existing: Educate &Manage Zero Water/Offsets 50%+ Future: Planning & Management

Optimizing Outdoor Water Use

AWE, Sept 2015:

170 Studies Reviewed Industry Reviewers

>Thin on Robust Documentation > Ripe for Further Research

Wednesday, August 6, 14

slide-25
SLIDE 25

Wednesday, August 6, 14

slide-26
SLIDE 26

.Getting the Most for Our Water: Treated Dr Wtr .measure to manage : little measurement now, what is shows poor effic (CRC STF) (Alb-others: top 10% use 25% of wtr) = little wtr management/value/productivity (PK demand graph) little research to document implementable savings ( AWE) . definable goals = water budget (HRnch/Bldr/EPA paper/CA LCC/EPA/IA) real targets give tools their effectiveness, flex between communities .water key to urb LS assets/green infra (Denver > Drought 7% ‘let LS go’; rocks ^ urb heat island) (CNT: GrInfr becoming more important- in West needs water, for Diversity of LS types) currently little diversity (TX irrig LS inventory) using Huge Amounts of Water/Infra .Water Offset Programs : Approaching Net-Zero Water (AWE & CWIC)

Urban Landscape Water Budgets

Wednesday, August 6, 14