
SLIDE 1
A Gold Miner in the Making
May 2016
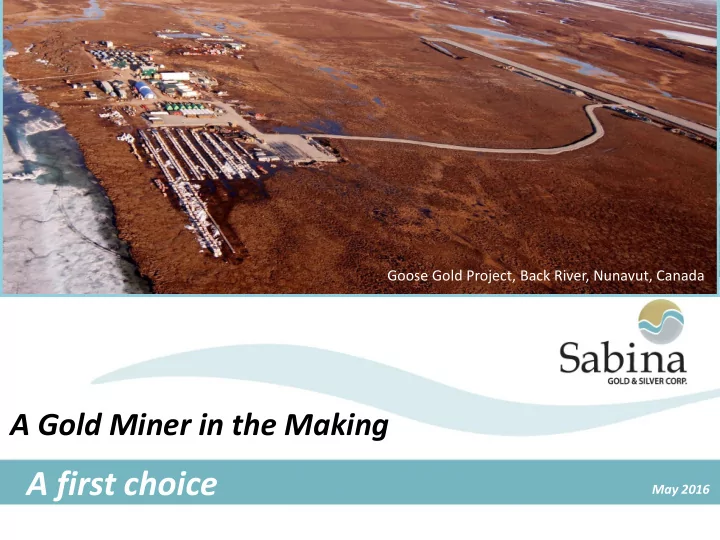
Goose Gold Project, Back River, Nunavut, Canada
A first choice May 2016 Forward Looking Information Statements - - PowerPoint PPT Presentation
Goose Gold Project, Back River, Nunavut, Canada A Gold Miner in the Making A first choice May 2016 Forward Looking Information Statements relating to our belief as to the timing of completion of the environmental assessment, the results of the
May 2016
Goose Gold Project, Back River, Nunavut, Canada
Statements relating to our belief as to the timing of completion of the environmental assessment, the results of the final public hearings, the timing of receipt of a project certificate and permits and the timing of the start of construction and the first gold pour, and the results of further optimization studies to the feasibility study, the potential tonnage and grades and contents of deposits and the potential production from and viability of Sabina’s properties are forward looking information within the meaning of securities legislation of certain Provinces in Canada. Forward looking information are statements that are not historical facts and are generally, but not always identified by the words “expects,” “plans,” “anticipates,” “believes,” “intends,” “estimates,” “projects,” “potential,” “opportunities,” and similar expressions, or that events or conditions “will,” “would.” “may,” “could,” or should occur. The forward looking information is made of the date of this presentation. This forward looking information is subject to a variety of risks and uncertainties which could cause actual events or results to differ materially from those reflected in the forward looking information, including, without limitation: the effects of general economic conditions; changing foreign exchange rates; risks associated with exploration and project development; the calculation of mineral resources and reserves; risks related to fluctuations in metal prices; uncertainties related to raising sufficient financing to fund the planned work in a timely manner and on acceptable terms; changes in planned work arising from weather, logistical, technical or other factors; the possibility that results of work will not fulfill expectations and realize the perceived potential of the Company’s properties; risk of accidents, equipment breakdowns and labour disputes; access to project funding or other unanticipated difficulties or interruptions; the possibility of cost overruns or unanticipated expenses in the work program; title matters; government regulation; obtaining and receiving necessary licences and permits; the risk of environmental contamination or damage resulting from Sabina’s operations and other risks and uncertainties including those described in Sabina’s annual information form for the year ended December 31, 2015 available at www.sedar.com Forward looking information is based on the beliefs, estimates and opinions of Sabina’s management on the date the statements are made. Sabina undertakes no obligation to update the forward looking information should management’s beliefs, estimates or opinions, or other factors, change, except as required by applicable law 2
3
1998 2002 2007 2009 2010 2012 2015
4.0 6.0 8.0
Gold Resource in Millions of oz.
1980’s & 90s George & Goose deposit discoveries 1997-2009 Project owned by Arauco, Kinross, Miramar & DPM 2010-2014 +325% resource growth under Sabina June 2009 Project acquired by Sabina
4
Measured & Indicated
Inferred
*See mineral reserves and resources estimate slides 26 & 27 for details Mineral Resource Estimate Oct/14 Tonnes (kt) Au (g/t) Metal (koz Au) Measured 10,273 5.27 1,740 Indicated 17,969 6.22 3,593 Measured and Indicated 28,242 5.87 5,333 Inferred 7,750 7.43 1,851 Mineral Reserve Estimate Aug/15 Classification Tonnes (kt) Au (g/t) Au (koz) Total Open Pit Proven 6,983 5.97 1,340 Probable 1,885 5.52 335 Total Underground Proven 20 9.52 6 Probable 3,471 7.37 822 Total Back River Property Proven 7,003 5.98 1,346 Probable 5,356 6.72 1,157
80% of open pit reserve is in Proven Category
6
Summary Results @US$1,150/oz Gold/ C$0.80 Exchange Pre-Tax NPV(5%) & IRR C$M / % $699 / 28.2% After-Tax NPV(5%) & IRR C$M / % $480 / 24.2% Payback Years 2.9 Mill Throughput tpd 3,000
diluted g/t Au 6.30g/t Gold Recovery % 93.0% Mine Life Years 11.8
250,000
198,000 On-Site Op. Costs C$/t milled $114.58 Total Cash Cost $US/oz $534 All-In Sustaining Cost $US/oz $620 LOM All-In Cash Cost* $US/oz $763 Pre-Production Capital C$M $415 Sustaining Capital C$M $185 Closure Capital C$M $64
*LOM All-In Cash Cost includes initial, sustaining and closure capital
QA/QP (see slide 25))
Operating Costs
NPV5% (C$M) IRR % Post-Tax
Base Case +10% +20% Capital Costs
715 653 592 529 468 36.2 34.1 32.0 29.7 27.3
659 591 536 474 415 31.8 29.9 27.8 25.6 23.4 Base Case 603 542 480 418 356 28.1 26.2 24.2 22.1 20.0 +10% 547 486 425 362 300 24.8 23.3 21.1 19.1 17.0 +20% 492 430 369 306 245 21.9 20.2 18.3 16.4 14.4
Sensitivity to Capex & Opex
7
Sensitivity to Gold Price and Exchange Rate
Gold price (US$/oz)
NPV5% (C$M)
Exchange Rate: US$:C$
IRR % Post-Tax
0.70 0.725 0.75 0.80 0.85 0.90 $ 1,000 472 421 375 289 210 140 23.9 22.2 20.5 17.4 14.3 11.3 $ 1,150 687 630 577 480 394 317 30.9 29.1 27.4 24.2 21.2 18.4 $ 1,250 832 769 711 606 513 430 35.1 33.3 31.6 28.3 25.3 22.5 $ 1,350 977 910 846 732 631 542 39.1 37.3 35.5 32.2 29.1 26.3 $ 1,500 1,191 1,117 1,048 923 809 710 44.5 42.7 41.0 37.6 34.5 31.6
Flotation vs whole ore leach Increased Recoveries Positive impact on CAPEX and OPEX Opportunities for satellite deposits (eg: George) Increased Gold Price US$1,200 gold price Echo, Llama UG & George are accretive to the project – increased mine life with existing resources Imbedded growth – all existing deposits remain open, numerous exploration
Personnel and expertise availability (both for construction and operations) Access to used equipment (mining, process and infrastructure) Exploration opportunities for many years to come
8
9
50 100 150 200 250 300 350 400 450 0% 5% 10% 15% 20% 25% 30% 35% 40% 45% 50%
LOM Annual Production (Koz/yr) After-Tax IRR (%) at $1,200/oz
After-Tax IRR and LOM Annual LOM Production Matrix
SBB
PVG KAM DNA GQC ICG AGB AMM PRO VIT BSX NCA MAX CNL TMR
Source: public information and Cormark Securities based on internal modelling of these projects at US$1200 gold and $0.75 US$:C$ Exchange
10
Parameter Units Back River Meliadine1 Hope Bay2 Meadowbank3 Torex4 2015 FS 2015 FS 2015 PFS Producing 2012 FS Au Price US$/oz 1,150 1,300 1,250 400 (2005 FS) Avg $1,386 Post Tax IRR % 24.2 10.3 40.0 12.8% (2005 FS) 24.2% Post Tax NPV5% $M 480 307 626 155.2(2005 FS) $900 Payback years 2.9 5.0 1.7 N/A 3.6 OPEX $/t 114.58
(OP/UG)
135.27
(UG)
143.00
(UG)
73.00 (2015)
(OP)
30.00
(OP)
LOM Cash Costs US$/oz 534 531 638 613 (2015) 504 Pre-Production CAPEX $M 415 1,047 206 710 (2007) 1.5 B (2012) 663 Sustaining CAPEX $M 185 411 334 N/A 15 Total Reserve koz 2,503 3,350 3,507 1,165 4,090 ktonnes 12,359 14,012 14,194 11,795 48,800 g/t 6.30 7.44 7.70 3.08 2.61 LOM Payable Au koz 2,319 3,214 3,200 4,273* 4,090 Annual Production koz 198 350 160 381 (2015) 337
1. Information retrieved from “Agnico Eagle Updated Technical Report on the Meliadine Gold Project, Nunavut, Canada, February, 11, 2015” from www.sedar.com 2. Information retrieved from News Release “TMAC Resources Completes Robust Pre-feasibility Study on the Hope Bay Project”, April 24, 2015 retrieved from www.tmacresources.com 3. Information retrieved from financial results of website www.agnicoeagle.com. Various dates. *Cumulative production plus 2013 reserves and resources 4. Information retrieved from “Morelos Gold Project – 43-101 Technical Report Feasibility Study, Guerrero, Mexico October 1, 2012” from
www.sedar.com
Comparisons to
provide validity to quality of Back River FS Comparable costs using a more conservative gold price
11
12
Equipment and material originating in western North America or in China will be consolidated at Vancouver, BC. Equipment and material originating in eastern North America or Europe will be consolidated at Becancour, QC.
Arctic Class Barge Arctic Class Transport Ship
13
Winter roads will be annually constructed beginning in Q4 Year -2 Construction will begin in December and take 6 weeks working on 2 fronts (starting at Goose and the MLA). The road will then remain operational for 7-8 weeks. During construction, up to 16 trucks will be used to move freight and fuel from the MLA to the Goose site. During operations, 23-27 trucks are required annually for freight and fuel from the MLA to Goose (~45 days)
Winter Road Transport Truck
Legislated time lines for review Precedents for all proposed Goose Project activities No red flags Significant engagement within the Kitikmeot & NWT Communities (247 engagements)* Office in Cambridge Bay with Community Liaison Funding of training initiatives
14
*Includes written correspondence – not including final public hearings
15
Process Milestone Date
Submitted Project Proposal To NIRB June 14, 2012 Minister directs NIRB to conduct a review of the project under Article 12, Part 5 NLCA December 17, 2012 NIRB issues Final Guidelines for the Review April 30, 2013 Submitted Draft Environmental Impact Statement January 20, 2014 Technical Meetings, Community Round-Table and Pre-Hearing Conference November 13-20, 2014 Pre-hearing Conference Decision released December 19, 2014 Final Environmental Impact Statement submitted November 23, 2015 Final Technical Review and Public Hearings April 25 – 30, 2016 NIRB Project Recommendation June 15, 2016 Minister’s Decision /Project Certificate from NIRB (EA Process completed) H2, 2016 Water License and all other permits H1, 2017
Kick off Engineering/Basic/Detailed June 2016 Continued optimization Studies (Metallurgy/flow sheet) Ongoing Engage Project debt/Financing advisor Q4, 2016 Receive Type ‘A’ Water License H1, 2017 Initial Sea lift Q3, 2017 Begin Constructing First (2018) Winter Ice Road Dec. 1, 2017 Begin Constructing Goose Site
Marshalling Deadline for 2018 Sealift July 1, 2018 Marshalling Deadline for 2019 Sealift July 1, 2019 First Gold
16
17
80 Km
18 CONVERGENCE
19
Indicated: 1.1 m oz @ 5.6
Inferred: 980k oz @ 6.32
~600k oz included in 6KFS
stand alone second mine Satellite with haulage via
High value potential to
20
21
22
Slide retrieved from GOLDCORP corporate presentation dated Nov/2015
23
Source: National Bank Financial – May 30, 2016
Executive Management Board of Directors Bruce McLeod, President, CEO & Director Bruce McLeod (Pres. & CEO) Elaine Bennett, VP Finance & CFO Roy Wilkes (Chairman) Nicole Hoeller, VP Communications & Corp. Secretary David Fennell Jonathan Goodman James Morton Technical Management Anthony Walsh Angus Campbell, VP Exploration Walter Segsworth Wes Carson, VP Project Development Anna Stylianides Matthew Pickard, VP, Enviro. & Community Relations
24
Sabina Gold & Silver Corp. Symbol: SBB Listed exchange TSX Market cap. ~C$310 million Shares outstanding 220 million Shares outstanding (diluted) 215 million Cash (Dec 31, 2015) C$18.4 million Debt None 52 week trading range C$0.315 -$1.86 Recent Price ~C$1.40 Analyst Coverage BMO Capital Markets Andrew Kaip Paradigm Capital Don MacLean Cormark Securities Tyron Breytenbach RBC Capital Markets Sam Crittenden National Bank Financial Adam Melnyck Dundee Capital Markets Ron Stewart Canaccord Eric Zaunscherb Haywood Geordie Mark Major Shareholders Holdings (I&O) Dundee Precious Metals 10.7% Sun Valley Gold 10.5% Silver Wheaton 5.3% Management (options included) 3.0%
25
New budget currently being developed
26
Classification
Contained Au (koz)
A gold price of US$1,250/oz is assumed. An exchange rate of CDN$1.15 to US$1.00 is assumed. The numbers might not add due to rounding. Notes for open pit: Dilution and recovery factors are applied as per open pit mining method. COG of 2.08 g/t was used for the Umwelt Open Pit Mineral Reserve Estimate. COG of 2.14 g/t was used for the Llama Open Pit Mineral Reserve Estimate. COG of 2.07 g/t was used for the Goose Main Open Pit Mineral Reserve Estimate. Notes for underground: Dilution and recovery factors are applied as per post pillar cut-and-fill underground mining method. COG of 3.86 g/t was used for the Umwelt underground Mineral Reserve Estimate. QP JDS
27
CIM definitions were used for the Mineral Resources.
101, take responsibility for the Mineral Resource estimates. Open pit Mineral Resources are constrained by an optimized pit shell at a gold price of US$1,500 oz. The cut-off grade applied to the open pit Resources is 1.0 g/t Au. The underground cut-off grade is 4.0 g/t Au for all George Mineral Resources (LCPn, LCPs, Locale 1, Locale 2, GH, and Slave), 3.5 g/t Au for Goose Main, Echo, and Llama, and 4.5 g/t for the Umwelt deposit. The George Mineral Resources were estimated within mineral domains expanded to a minimum width of 2 m for the underground Mineral Resources. Drilling results up to December 31, 2013 are included, except for Echo (July 4, 2014) and LOC1 and LOC2 (July 21, 2014). The numbers might not add due to rounding.
Classification Tonnes (kt) Au (g/t) Metal (koz Au) Measured 10,273 5.27 1,740 Indicated 17,969 6.22 3,593 Measured and Indicated 28,242 5.87 5,333 Inferred 7,750 7.43 1,851
Mineral Resources that are not mineral reserves do not have demonstrated economic viability. Mineral resource estimates do not account for mineability, selectivity, mining loss and dilution. There is no certainty that the inferred mineral resources will be converted to measured and indicated categories through further drilling, or into mineral reserves, once economic considerations are applied.
28 The FS was prepared under the direction of JDS Energy & Mining Inc. by leading independent industry consultants, all Qualified Persons (QP) under National Instrument 43-101. Angus Campbell, P.Geo, Vice-President, Exploration, is a qualified person under NI-43-101 where the information relates to mineral resource estimates and Wes Carson, P.Eng Vice-President, Project Development is a qualified persons under NI 43-101 for the feasibility study and both approve the scientific and technical information contained herein. A National Instrument compliant 43-101 technical report will be filed on the project within 45 days from September 14, 2015. Further information can be found at Technical Report and Feasibility Study for the
Back River Gold Property, Nunavut” dated June 22, 2015 and filed on SEDAR at http://www.sedar.com. Qualified Person, Designation Company QP Responsibility/Role Gord Doerksen, P.Eng. JDS Energy & Mining Inc. Executive Summary, Introduction, Reliance
Market Studies, Capex, Opex, Economic Analysis, Adjacent Properties, Environmental, Other Relevant Data, Interpretations, Recommendations, References, Abbreviations, Project Execution Plan, Logistics, Infrastructure, G&A Dino Pilotto, P.Eng. JDS Energy & Mining Inc. Mining Methods Andrew Fowler, MAusIMM, CP (Geo) AMC Mining Consultants (Canada) Ltd. Mineral Resource Estimates for George Dinara Nussipakynova, P.Geo AMC Mining Consultants (Canada) Ltd. Mineral Resource Estimates for Goose John Morton Shannon, P.Geo AMC Mining Consultants (Canada) Ltd. Property Description, Accessibility, History, Geology, Deposits, Exploration, Drilling, sample Preparation, Data Verification Maritz Rykaart, P.Eng. SRK Consulting (Canada) Inc. Geochemistry, Tailings Management, Water Management Stacy Freudigmann, P.Eng Canenco Canada Inc. Metallurgy, Recoveries, Process Rob Mercer, Ph.D., P.Eng Knight Piésold Ltd. Geomechanical