
SLIDE 1
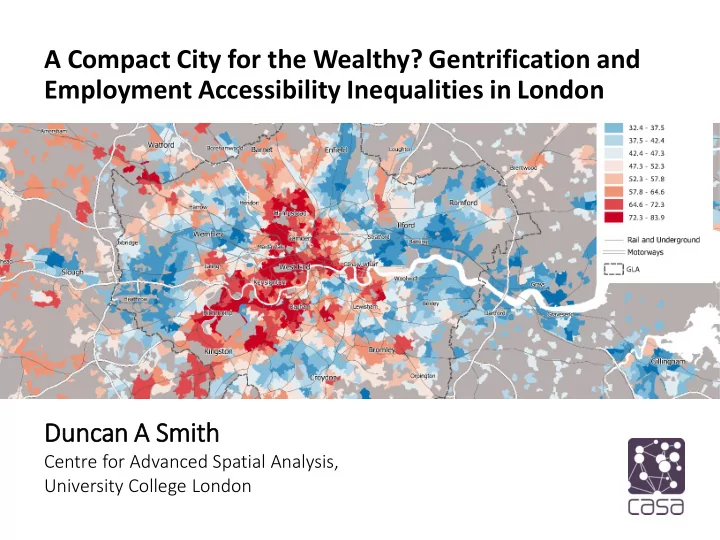
A Compact City for the Wealthy? Gentrification and Employment Accessibility Inequalities in London Du Duncan A A Sm Smith
Centre for Advanced Spatial Analysis, University College London
A Compact City for the Wealthy? Gentrification and Employment - - PowerPoint PPT Presentation
A Compact City for the Wealthy? Gentrification and Employment Accessibility Inequalities in London Du Duncan A A Sm Smith Centre for Advanced Spatial Analysis, University College London In Intro Academic Background Research focused in
Centre for Advanced Spatial Analysis, University College London
Academic Background Research focused in urban geography, sustainable transport, GIS and online
leader of CASA MSc in Spatial Data Science. Twitter- @citygeographics Blog- http://citygeographics.org LSE Cities I worked as GIS Officer at LSE Cities 2012-14, mainly for the London Electric City and Rio Urban Transformations Urban Age
research themes of sustainable urban form and comparative urbanism.
Long Term Compact City Policy Consensus
Compact city planning enabled inner-city densification, mix-of-uses, public transport investment and public realm improvement since late 1990s in UK, earlier in other European countries.
London Achieving these Aims
Transformation of Inner London and Outer Metropolitan
pedestrian and cycling improvements. Vibrancy, economic and sustainability success story.
Yet Failing in Equity Terms?
Severe housing affordability crisis; housing developments mainly for wealthier groups; “affordable” housing rarely affordable; very little new council housing; major estate renewal creating displacement...
Gentrification first identified in London in 1960s (Glass, 1964). Appears to be continued social transformation of Inner London in last decade, less affluent groups priced out. Useful to have more analysis of these patterns. Further inner city gentrification likely to have accessibility consequences as more affluent groups living closer to opportunities and public transport
affluent populations. Aim to analyse the following empirically for London-
sustainable transport modes.
Evolution to Post-Industrial Economy Gentrification is “the social and spatial manifestation of the transition from an industrial to a post-industrial urban economy” (Hamnett, 2003). An expanded middle class begins to locate in areas of well-built, low-priced, inner-city districts occupied by working classes. Rent-Gap and Class-based Capital Accumulation Neo-Marxist interpretations emphasise capital accumulation, where gentrifiers exploit the difference between initial house prices in working class neighbourhoods and the longer term location potential of inner city (Smith, 1979). New-Build Gentrification The value-uplift perspective also aligns with the aims of real-estate
(Davidson and Lees, 2010), with areas of major housing development targeting affluent buyers. Particularly important in London, with significant new-build housing.
Work presented relates to two comparative urbanism research projects at CASA led by Professor Mike Batty- RESOLUTION Joint Brazil-UK research project investigating accessibility inequalities and segregation in London and Sao
Completed 2018. SIMITRI New project investigating mega-cities and housing inequalities, focussed on Pearl River Delta in China.
Greater London population continues to grow, 8.9 million 2018. Projected to reach 10 million by 2030 (GLA, 2016). Between 2011-2016 GLA population grew by 600k (7.5%), with 300k of growth in Inner London. Inner London retains majority of London jobs (2.6 million / 60%). Substantial expansion in public transport trips (although recent levelling). Decline in percentage of car trips, stable in absolute terms.
Top right graph from Housing in London Report 2019. Bottom right graph from Travel in London Report 2019.
Study Area- Subregions
http://luminocity3d.org/
Study Area- Subregions
Population 2011
(000’s)
Population 2016
(000’s)
2011-2016
(000’s)
Jobs by Workplace 2011 (000’s) Greater London Authority 8,159 8,773 +614 (7.5%) 4,496 Metropolitan Region 15,946 16,941 +995 (6.2%) 8,069 Inner GLA 3,224 3,523 +299 (9.3%) 2,662 Outer GLA 4,935 5,250 +315 (6.4%) 1,834 Outer Metro. Area 7,787 8,168 +382 (4.9%) 3,573
Housing completions steadily risen since the formation of the GLA. More ambitious targets in the current and forthcoming London Plans. Affordable housing completions fallen massively during financial crisis and austerity periods. Also “Affordable Rent” (typically 80% market rate) and Intermediate housing typically not affordable for most of population. Graphs from the Housing London Report 2019 by GLA->
Combination of continued population growth, financial crisis, austerity and lack of affordable housing had drastic impact
London since 2010. What are the demographic impacts of these changes?
Data Source: Nationwide 2017
Would like to analyse residential patterns by income. No income data recorded in the UK census. Used occupational class (SOC) instead. Arguments for using occupational class data as a substitute-
education)
behaviour, housing tenure) and Annual Population Survey dynamics Problems with occupational class data-
economy etc. Alternative approaches available (e.g. Savage et al. 2013, A New Model of Social Class).
Standard Occupational Classification consists of the following major groups: 1. Managers, Directors and Senior Officials 2. Professional Occupations 3. Associate Professional and Technical Occupations 4. Administrative and Secretarial Occupations 5. Skilled Trades Occupations 6. Caring, Leisure and Other Service Occupations 7. Sales and Customer Service Occupations 8. Process, Plant and Machine Operatives 9. Elementary Occupations
Group Description GLA % 2011
GLA Weekly Median Income 2016 Mean Age (2011)
12.7
£ 1,125
44
22.8
£ 824
43
17.3
£ 674
41
12.1
£ 517
43
7.8
£ 522
42
7.3
£ 403
40
6.8
£ 401
34
4.6
£ 560
45
8.7
£ 371
38
Data Source: Annual Survey of Hours and Earnings 2016
0.0 0.2 0.4 0.6 0.8 1.0 1.2 1.4 1.6 1.8 Millions
Occupational Classes Total Population in London Metro Region 2011
Manag Prof Assoc Prof Admin Skilled Trades Other Serv Sales Process Element Manag 1 0.76** 0.79** 0.23**
Prof 0.76** 1 0.87** 0.23**
AssocP 0.79** 0.87** 1 0.36**
Admin 0.23** 0.23** 0.36** 1 0.61** 0.55** 0.50** 0.39** 0.25** SkilledT
0.61** 1 0.80** 0.70** 0.80** 0.66** OtherS
0.55** 0.80** 1 0.74** 0.69** 0.70** Sales
0.50** 0.70** 0.74** 1 0.73** 0.81** Process
0.39** 0.80** 0.69** 0.73** 1 0.81** Element
0.25** 0.66** 0.70** 0.81** 0.81** 1
Pearson Correlation Matrix Between Occupational Classes by Residence 2011, MSOA scale-
Occupational Class- Professional Groups 2011
Average Gross Income
Considerable residential segregation by
professional classes strongly correlated in terms of residential geography. Mapping analysis shows professional concentrations in Inner London, radial sectors to north-west and south-west Outer London, and beyond the GLA boundary.
Inner London has increasing proportions of professional classes, faster rate than region & UK. Total prof. 55% in 2006, to 61.4% in 2016. Proportional losses in all other classes. Opposite pattern in Outer London. Fits “suburbanisation of deprivation” argument, made by Travers, Sims, Bosetti (2016), Housing and Inequality in London, Centre for London.
Average local authority in GB- increase professional proportion from 41% in 2006 to 45% in 2016, and moderate increase in working population (+8%).
Strong Regional Geography of Professional Classes Most affluent groups concentrated in Inner London, with radial sectors of affluence extending to suburbs. Additionally East-West split, and higher incomes outside of the GLA. Gentrification Patterns are Exacerbating Residential Segregation Recent changes showing increasing proportions of most affluent classes in Inner London, and decreasing proportions of less affluent groups. Significant population growth in inner boroughs indicating new-build gentrification processes. Inner London now 62% from professional classes (some boroughs 70%+). Overall patterns indicate sub-regional segregation by
Given growth, gentrification and patterns of segregation by occupational class in Inner London, can anticipate resulting differences in accessibility for different classes. Transit networks highly radial in London, while employment and many other opportunities strongly concentrated in Inner London. Inner London also better environment for walking and cycling.
Car trips not strongly linked to affluence (relate to percentage of jobs in Inner London). Instead the main patterns are wealthy groups using rail/metro (more likely to work in Inner GLA) while less affluent groups more likely to use bus and walk.
Decided to focus on commuting and accessibility to jobs. Strong links to residential location (but more comprehensive analysis would consider other types of trips: education, health etc.). Why Not Use PTALs? TfL produce PTAL measure, access to public transport stations/stops. Very useful, but limitations for this research:
(jobs, shops, education…);
for equity analysis. Place-Based and Person-Based Accessibility Measures Location-based accessibility analysis produces place measures. To consider accessibility by occupational classes, we need person-based measures. This is achieved by weighting location results according to population
at small area (MSOA) scale.
Transit Timetable, Stations and Street Network Calculate journey cost from all origins to all destinations by multiple transport modes, combine with opportunity destinations. Open Data and OpenTripPlanner Key data inputs for accessibility modelling are street network and stops and the public transport
for Transport (converted by Dr Richard Milton at CASA). Street network from Ordnance Survey Open Roads. OpenTripPlanner popular transit accessibility modelling tool, used for this research.
Morning Peak Only
This model has been run for the morning peak only. Most common commuting time. More comprehensive analysis needs to consider part- time, shift work outside peak periods, as often greater inequalities by transit outside of peak periods. Travel Time Based, Rather than Fares Generalised cost used in some aspects of modelling (e.g. prefer in-vehicle time to waiting and walking) but model does not include fares. Some consideration of this through modelling more affordable modes (bus, walk) independently.
Temporal Variation Accessibility can change minute by minute in relation to service
intervals across morning peak. Full details of accessibility modelling method in working paper- https://www.ucl.ac.uk/bartlett/casa/publications/2018/sep/casa- working-paper-211
Public transport services and jobs focussed in Inner London. Result of housing affordability, gentrification, planning policy processes.
Public transport services and jobs focussed in Inner London. Result of housing affordability, gentrification, planning policy processes.
Pl Plac ace-Bas ased to to Popula latio tion Based Accessib ibili ility ty by by Sub ub-Regio ion
Converting place-based measure to population-based measure produces a distribution of accessibilities for each population group for each mode. Main driver of inequalities in the GLA will be differences between Inner and Outer London. We can summarise this by plotting distributions by sub-regions-
Cumulative Accessibility to Employment for Working Population, 60 minutes by Sub-Region
Accessib ibili ility to to Jobs by by Travel l Mod
nd Occupatio ional l Clas lass
Access cessibi bility ty to to jobs bs, differ erenc nces es from
an by occup upati tion
ss- 60 minut nutes es
Accessi essibi bility to jobs bs, differ erenc nces es from
dian an by occup upation
ss- 60 minu nutes es
Testing Different Commute Threshold Times
30 mins 45 mins 60 mins 75 mins 90 mins Mean Median Mean Median Mean Median Mean Median Mean Median Manag 12.4 6.4 7.3 18.4 4.2 4.0 3.0 2.1 2.3 2.1 Prof 14.7 10.0 11.3 37.4 6.8 7.4 4.5 3.2 3.5 3.2 AssocProf 20.2 14.2 15.2 53.9 8.2 9.6 5.3 5.4 4.3 4.9 Admin
SkillTrad
OtherServ
Sales
Process
Element
30 mins 45 mins 60 mins 75 mins 90 mins Mean Median Mean Median Mean Median Mean Median Mean Median Manag 14.1 4.4 9.3 8.0 7.4 19.2 5.3 7.3 3.8 4.1 Prof 14.9 7.3 12.5 11.7 11.0 44.6 8.6 17.7 6.2 6.1 AssocProf 20.6 10.0 18.4 19.9 15.2 71.5 11.0 28.6 7.4 8.1 Admin
SkillTrad
OtherServ
Sales
Process
Element
0.0
Public Transport- Percentage Differences from Population Average Bus Only- Percentage Differences from Population Average
0.0 10.0 20.0 30.0 Elementary Process Sales OtherService SkilledTrades Admin AssocProf Professional Managers Car PT Bus Walk
Accessibility Advantages for Wealthier Classes Accessibility advantages to employment for wealthier classes, particularly for more affordable shorter distance travel: bus and walking modes. Greatest advantages to the Professional and Associate Professional classes, with Management class third. Below average for all other groups. Elementary class fares better (council housing?). Time Sensitive Results Inequalities fall as commuting times increase. Metro/rail inequalities greater for commutes up to 45 minutes. Bus inequalities greater for longer trips of 60-75 minutes. Accessibility Inequalities Likely to Increase Analysis for 2011. These inequalities likely to become greater given expansion of the most affluent occupational classes in Inner London.
Important housing tenure aspects to residential location and accessibility patterns. Ownership and Accessibility Trade-Off Rental housing generally more accessible. Some groups may sacrifice transit accessibility for security and investment of mortgage. While gentrification patterns generally about increasing home ownership for wealthy classes in relatively accessible areas. Council Housing Remains Important Social renting high (40%) amongst least affluent classes in Inner London. Important buffer against gentrification. But very little new social housing built in UK in last 30 years, sector under pressure.
Professional classes combine accessibility advantages with highest rates of
Skilled Trades and Process classes have the poorest accessibility to jobs, but also least likely to work in Inner London and 70% car commuting. These groups favouring home ownership in wider region, less demand for transit access to Inner London. Most disadvantaged classes include Sales and Other Services, with lower incomes, below average accessibility for bus and walking, and low home
accessibility results.
Keep Public Transport Costs Low
Bus trips more affordable, but jobs accessibility by bus limited for many groups. Tube and rail affordability increasingly important where less affluent populations mainly in Outer London. Mayor already capped fares, good policies such as ‘hopper fare’ for bus interchanges. Also trying to expand TfL control of commuter rail network. TfL facing significant budget problems, so this policy will likely come under strain in coming years.
Major Expansion of Affordable Housing
Inner London now completely unaffordable for majority of the population, and increasingly the case for some parts of Outer
financial crisis, huge demand for major change. Need for genuinely affordable housing-council housing- in Inner London and Outer London town centres.
Promote Polycentric Development? Concentration of jobs in Inner London central to economic success. Could however be complemented with stronger sub-centres in Outer London and OMA, e.g. Croydon, Wembley, Stratford… These locations successfully expanding as residential and retail centres, but
markets volatile in face of economic and social disruption. Improve Orbital Public Transport? Radial public transport locks in inner city advantages. Some orbital improvements pursued such as Overground, South London tram
If London social geography going to be more like Paris, will similar ambitious approach to regional orbital transit be necessary?
London Growing Significantly, Led by Inner City and Outer Metro Centres In Line with Compact City Policies Significant Levels of Residential Segregation in London by Occupational Class Translates into Accessibility Inequalities as Affluent Groups More Concentrated in Inner City Evidence is that Residential Segregation Further Increased Since Financial Crisis, Mainly New Build Gentrification(?) Much More Ambitious Response in Affordable Housing Development Needed
Can Model Transit Accessibility More Comprehensively Using Open Data and Software Useful to Have Population-Based Accessibility Measures to Complement Place-Based Measures Not Considered Other Trip Types, Fares, Part-Time & Shift Workers etc. Could Also Use this Approach for Testing Impacts of New Transport Infrastructure, Housing, Rather than Modelling Present Situation
Accessibility Methodology- Smith D A (2018), Employment Accessibility in the London Metropolitan Region: Developing a Multi-Modal Travel Cost Model Using OpenTripPlanner- https://www.ucl.ac.uk/bartlett/casa/publications/2018/sep/cas a-working-paper-211 Gentrification and Occupational Class change in London- Smith D A (2020?) Compact City for the Wealthy?, Journal of Transport Geography (under review) Segregation and RESOLUTION Project- Barros & Feitosa (2018), Uneven geographies: Exploring the sensitivity of spatial indices of residential segregation, Environment & Planning B, https://doi.org/10.1177/2399808318760572
CASA- http://casa.ucl.ac.uk http://blogs.casa.ucl.ac.uk Personal- citygeographics.org
@citygeographics
Email- duncan.a.smith@ucl.ac.uk