
SLIDE 1
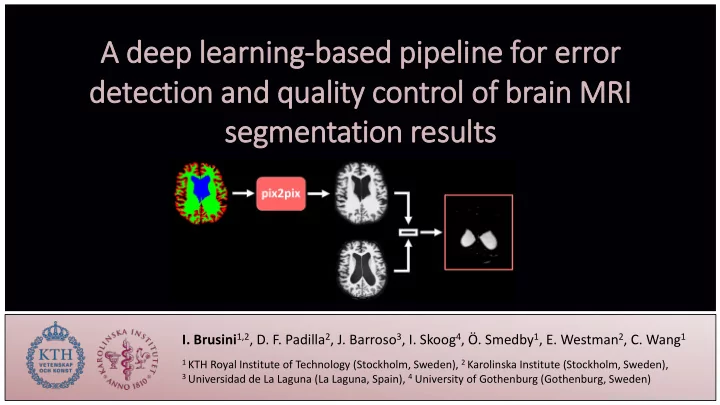
A A deep ep l lear arni ning-bas based ed p pipel peline ne f for e error de detecti tion and and qua quality ity c contr trol of
- f br
brai ain M MRI segm egmentatio tion r resu esults ts
- I. Brusini1,2, D. F. Padilla2, J. Barroso3, I. Skoog4, Ö. Smedby1, E. Westman2, C. Wang1
1 KTH Royal Institute of Technology (Stockholm, Sweden), 2 Karolinska Institute (Stockholm, Sweden), 3 Universidad de La Laguna (La Laguna, Spain), 4 University of Gothenburg (Gothenburg, Sweden)