
SLIDE 1
7/30/2012 1 ATOMIC ABSORPTION SPECTROMETRY PRINCIPLES AND METHOD
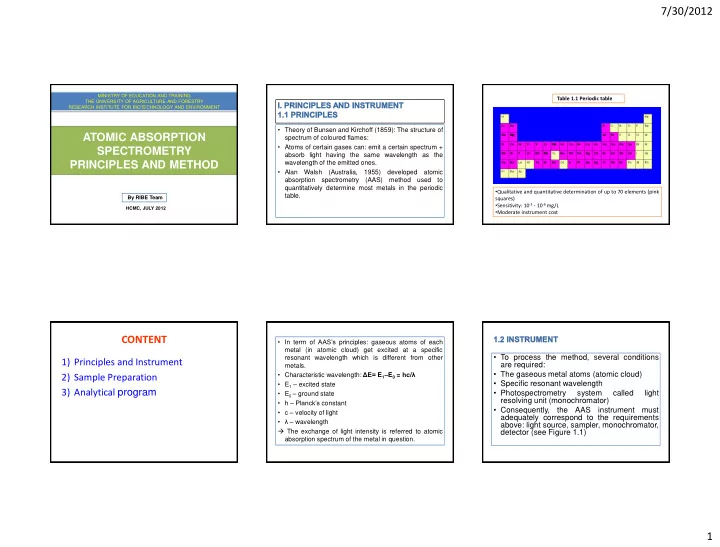
MINISTRY OF EDUCATION AND TRAINING THE UNIVERSITY OF AGRICULTURE AND FORESTRY RESEARCH INSTITUTE FOR BIOTECHNOLOGY AND ENVIRONMENT
By RIBE Team
HCMC, JULY 2012
CONTENT
1) Principles and Instrument 2) Sample Preparation 3) Analytical program
- Theory of Bunsen and Kirchoff (1859): The structure of
spectrum of coloured flames:
- Atoms of certain gases can: emit a certain spectrum +
absorb light having the same wavelength as the wavelength of the emitted ones.
- Alan Walsh (Australia, 1955) developed atomic
absorption spectrometry (AAS) method used to quantitatively determine most metals in the periodic table.
- In term of AAS’s principles: gaseous atoms of each
metal (in atomic cloud) get excited at a specific resonant wavelength which is different from other metals.
- Characteristic wavelength: ΔE= E1–E0 = hc/λ
- E1 – excited state
- E0 – ground state
- h – Planck’s constant
- c – velocity of light
- λ – wavelength
The exchange of light intensity is referred to atomic absorption spectrum of the metal in question.
- Qualitative and quantitative determination of up to 70 elements (pink
squares)
- Sensitivity: 10-3 - 10-6 mg/L
- Moderate instrument cost
Table 1.1 Periodic table
- To process the method, several conditions
are required:
- The gaseous metal atoms (atomic cloud)
- Specific resonant wavelength
- Photospectrometry
system called light resolving unit (monochromator)
- Consequently, the AAS instrument must