7/10/20 AAR WEB Series-III 9 th , July., 2020 1. The temperature - - PDF document

7 10 20
SMART_READER_LITE
LIVE PREVIEW

7/10/20 AAR WEB Series-III 9 th , July., 2020 1. The temperature - - PDF document

7/10/20 AAR WEB Series-III 9 th , July., 2020 1. The temperature ranges of Ammonia Ultra low temperature freezing plant vapor compression refrigeration systems using Ammonia 2. Applications 3. Ammonia low temperature refrigeration systems


slide-1
SLIDE 1

7/10/20 1

Ultra low temperature freezing plant using Ammonia

Hiroyuki Egashira Mayekawa Mfg. Co., Ltd.

AAR WEB Series-III

9th, July., 2020

9 July 2020 AAR WEBINAR SERIES -3 1

1

  • 1. The temperature ranges of Ammonia

vapor compression refrigeration systems

  • 2. Applications
  • 3. Ammonia low temperature refrigeration

systems

  • 4. Case Study

9 July 2020 AAR WEBINAR SERIES -3 2

2

  • 1. The temperature ranges of vapor

compression refrigeration systems

9 July 2020 AAR WEBINAR SERIES -3 3

3

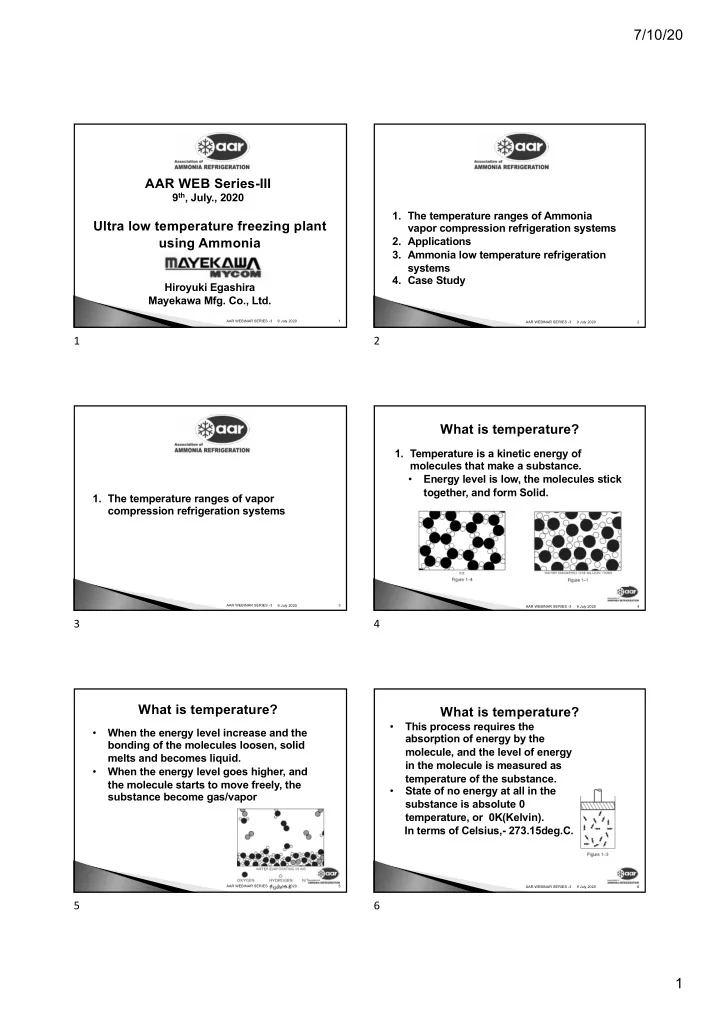
  • 1. Temperature is a kinetic energy of

molecules that make a substance.

  • Energy level is low, the molecules stick

together, and form Solid.

What is temperature?

9 July 2020 AAR WEBINAR SERIES -3 4

4

  • When the energy level increase and the

bonding of the molecules loosen, solid melts and becomes liquid.

  • When the energy level goes higher, and

the molecule starts to move freely, the substance become gas/vapor

What is temperature?

9 July 2020 AAR WEBINAR SERIES -3 5

5

  • This process requires the

absorption of energy by the molecule, and the level of energy in the molecule is measured as temperature of the substance.

  • State of no energy at all in the

substance is absolute 0 temperature, or 0K(Kelvin). In terms of Celsius,- 273.15deg.C.

What is temperature?

9 July 2020 AAR WEBINAR SERIES -3 6

6

slide-2
SLIDE 2

7/10/20 2

Substances change its phases:

  • Solid
  • Liquid
  • Vapor

Each substance has specific temperature , pressure and specific energy level to change phases This can be visualized in P-H Diagram

Change of Phase

9 July 2020 AAR WEBINAR SERIES -3 7

7

P-H Diagram and Phase

Example of phases (CO2)

9 July 2020 AAR WEBINAR SERIES -3 8

8

Previous slide is CO2 P-H diagram, that shows the 3 phases of CO2. I could not find Ammonia P-H diagram to show the same phase changes, but in the same manner, vapor, liquid and solid states exist for Ammonia.

9 July 2020 AAR WEBINAR SERIES -3 9

Phase of the material 9

  • Vapor compression refrigeration

system operate between vapor and liquid.

Vapor compression refrigeration Cycle

Condenser Compressor Evaporator 1 2 3 4 Heat Absorption Heat Rejection Expansion Valve

9 July 2020 AAR WEBINAR SERIES -3 10

10

Vapor Compression Refrigeration Cycle on P-H Diagram Example of phases (CO2)

9 July 2020 AAR WEBINAR SERIES -3 11

11

As shown in the previous slide, the vapor compression refrigeration cycle operate where the liquid and gas co-exist.

9 July 2020 AAR WEBINAR SERIES -3 12

Vapor compression refrigeration Cycle 12

slide-3
SLIDE 3

7/10/20 3

P-H Diagram NH3

100kg/hr+12.3kg/hr 35.5kW 112.3kg/hr 9 July 2020 AAR WEBINAR SERIES -3 13

Vapor compression refrigeration Cycle 13

We usually operate at the very high pressure side of Ammonia, so we do not think about the solid state of Ammonia. However, Ammonia also reaches solid state at -77.72 deg.C., at around 0.06bar A.

9 July 2020 AAR WEBINAR SERIES -3 14

Vapor compression refrigeration Cycle 14

Mol Weight Te at 0barG Te at -0.8barG Freezing Point Ammonia NH3 17

  • 33.6
  • 61.6
  • 77.73

Carbon Dioxide CO2 44

  • 56.6

Propane C3H8 44

  • 42.4
  • 73.6
  • 187.7

Nitrogen N2 28

  • 196.0
  • 206.3
  • 210

Vapor compression refrigeration system Evaporating temperature limits Of various substance

9 July 2020 AAR WEBINAR SERIES -3 15

15

I selected

  • 1. the atmospheric pressure as a bench

mark.

  • 2. -0.8barG, as economical limit
  • 3. freezing point as the limit set by the law
  • f physics.

.

9 July 2020 AAR WEBINAR SERIES -3 16

Vapor compression refrigeration system Evaporating temperature limits Of various substance

16

Please note:

  • 1. -0.8 barG pressure, I consider as the
  • perational limit of standard rotating

equipment.

  • 2. Freezing point is where vapor

compression system cannot work because there is no liquid.

9 July 2020 AAR WEBINAR SERIES -3 17

Vapor compression refrigeration system Evaporating temperature limits Of various substance

17

CO2 has a peculiar characteristics. CO2 freezes at -56.6deg.C., at 5.2bar.A. The temperature limit of CO2 vapor compression system is much higher than Ammonia. Considering CO2’s efficiency does not match Ammonia below -40deg.C., the application of CO2 is limited between -40 and -50deg.C only.

9 July 2020 AAR WEBINAR SERIES -3 18

Vapor compression refrigeration system Evaporating temperature limits Of various substance

18

slide-4
SLIDE 4

7/10/20 4

Propane’s evaporating temperature is -73.6 deg.C. at -0.8barG. So as it can achieve

  • approx. 10 deg.C. lower than Ammonia.

In this case, the problem is, Propane is highly explosive substance.

9 July 2020 AAR WEBINAR SERIES -3 19

Vapor compression refrigeration system

19

Vapor compression refrigeration system Comparison of NH3 and CO2 (Booster)

NH3 CO2 Tc deg.C

  • 5
  • 5

Te deg.C

  • 50
  • 50

Swept Volume m3/hr 659 659 Pd kg/cm2 3.62 31.1 Ps kg/cm2 0.42 6.96 Weight flow kg/hr 186.1 9409 Capacity kW 64.0 638.8 BkW 30.2 272.4 COP 2.12 2.35

9 July 2020 AAR WEBINAR SERIES -3 20

20

As you can see, for the temperature of

  • 50deg.C evaporation and -5 deg.C.

condensing, CO2 have 10 times the capacity at 9 times the power. This shows that it requires 1/10 the size of compressor for CO2 cascade system, but in terms of power saving, 10% of the booster. In the tropical climate, high stage has to be Ammonia.

9 July 2020 AAR WEBINAR SERIES -3 21

Vapor compression refrigeration system Comparison of NH3 and CO2 (Booster)

21

Saving of 10% of booster power is negligible for the entire system. Also consider the high pressure design for the discharge side of CO2 and the limited application range of -45 to -55. Down to -60deg.C. can be achieved by Ammonia, there is no reason for us to invest for CO2 cascade system.

9 July 2020 AAR WEBINAR SERIES -3 22

Vapor compression refrigeration system Comparison of NH3 and CO2 (Booster)

22

Vapor compression refrigeration system Comparison of NH3 and Propane (Booster)

NH3 PROPANE Tc

  • 5
  • 5

Te

  • 60
  • 60

Swept Volume(m3/hr) 1210 1210 Pd kg/cm2 3.62 4.11 Ps kg/cm2 0.22 0.44 Weight flow kg/hr 222.5 1157 Capacity(kW) 75.3 104.4 BkW 57.1 69.2 COP 1.32 1.51

9 July 2020 AAR WEBINAR SERIES -3 23

23

For the low temperature application with cascade system, Propane is a better

  • ption.

However, Propane is an explosive gas and system as well as the handling of the gas would cost dearly.

9 July 2020 AAR WEBINAR SERIES -3 24

Vapor compression refrigeration system Comparison of Propane and CO2 (Booster)

24

slide-5
SLIDE 5

7/10/20 5

Down to -60deg.C. Ammonia is the best refrigerant, since we can achieve the temperature with the equipment we already have. What are the specific application for this kind of temperature?

Ammonia low temperature application

9 July 2020 AAR WEBINAR SERIES -3 25

25

  • 1. Applications

9 July 2020 AAR WEBINAR SERIES -3 26

26

  • 1. Food Preservation

Most of the products can be stored for months at -25 deg.C.

9 July 2020 AAR WEBINAR SERIES -3 27

27

Great exceptions are:

  • Premium Grade Ice Cream -30deg.C.
  • Premium Grade Tuna
  • 60deg.C.
  • 1. Food Preservation

9 July 2020 AAR WEBINAR SERIES -3 28

28

For the food freezing, the faster the better.

Freezing of Food

Quick Freezing

Faster the freezing, ice crystal formed in the cell is smaller, and less damages to the cell membrane. With damaged cell membrane, cytoplasm flows out at the time of defrost.

Normal Freezing Before Freezing

9 July 2020 AAR WEBINAR SERIES -3 29

29

Low temperature is essential for the fast freezing. However, the low temperature alone does not insure the fast freezing.

Freezing of Food

9 July 2020 AAR WEBINAR SERIES -3 30

30

slide-6
SLIDE 6

7/10/20 6

Typical temperature pattern of freezing. Initial temperature is high. It quickly goes near freezing point, then stay there.

Freezing of Food

9 July 2020 AAR WEBINAR SERIES -3 31

31

Only after the freezing, the temperature goes

  • down. The refrigeration system designed for low

temperature operate at higher temperature most

  • f the time.

Freezing of Food

9 July 2020 AAR WEBINAR SERIES -3 32

32

Typical temperature pattern of freezing. Surface freezes immediately ,but it will take longer for the center to freeze.

Freezing of Food

9 July 2020 AAR WEBINAR SERIES -3 33

33

Since the lower the temperature, the cost of freezing is higher, it is always the balance between the cost of freezing and cost of storage against market price.

Freezing of Food

9 July 2020 AAR WEBINAR SERIES -3 34

34

IQF is a solution that make a consistent low temperature operation and quick freezing possible

Freezing of Food

9 July 2020 AAR WEBINAR SERIES -3 35

35

Impingement freezer improve the heat transfer

  • f surface to shorten the freezing time.

Freezing of Food

Conventional Air Flow Impingement Air Flow Uniform Flow One Side Two Sice Product Cold Air Slit Cold Air Slit Coanda Effect Im pinging Jet Slit Cold Air Cold Air Im pinging Jet Coanda Effect

9 July 2020 AAR WEBINAR SERIES -3 36

36

slide-7
SLIDE 7

7/10/20 7

The direction of the research and development is how to make a same quality at the temperature easily available by Ammonia, that is down to -40 deg.C.

Freezing of Food

9 July 2020 AAR WEBINAR SERIES -3 37

37

Cryogenic Freezing This is the process where inert gas, such as N2 and CO2 are directly sprayed on the products. N2: -196.9 deg.C. CO2: -78.5 deg.C.(Solid)

Freezing of Food

9 July 2020 AAR WEBINAR SERIES -3 38

38

.

Freezing of Food

9 July 2020 AAR WEBINAR SERIES -3 39

Even though the low temperature freezing is possible with Cryogenic, it requires continuous supply of N2 or CO2.

39

.

Freezing of Food

9 July 2020 AAR WEBINAR SERIES -3 40

Impingement technology IQFs make the quality

  • f freezing equal for most of the products.

So when the production scale goes up and continuous operation is required, they are replaced with impingement IQFs.

Conventional Air Flow Impingement Air Flow Uniform Flow One Side Two Sice Product Cold Air Slit Cold Air Slit Coanda Effect Im pinging Jet Slit Cold Air Cold Air Im pinging Jet Coanda Effect

40

Cryogenic is one method of keeping the temperature of the chemical reactions in pharmaceutical and chemical process.

Cryogenic

9 July 2020 AAR WEBINAR SERIES -3 41

It is an inexpensive method of low temperature cooling for research and development. .

41

Cryogenic

9 July 2020 AAR WEBINAR SERIES -3 42

Often, -196.9deg.C. is over spec for the process. Continuous supply of N2 is required. For higher quantity with relatively higher temperature requirement, it can be replaced with Ammonia refrigeration system. We will see this in our case study.

42

slide-8
SLIDE 8

7/10/20 8

  • 1. Ammonia low temperature refrigeration

systems

9 July 2020 AAR WEBINAR SERIES -3 43

43

P-H Diagram NH3 Single Stage Te=-5 deg.C.

100kg/hr+12.3kg/hr 35.5kW 112.3kg/hr 9 July 2020 AAR WEBINAR SERIES -3 44

44

P-H Diagram NH3 Single Stage Te=-40 deg.C. (Imaginary)

136.5kg/hr 100kg/hr+36.5kg/hr 38.6kW 9 July 2020 AAR WEBINAR SERIES -3 45

45

Idea of System A

9 July 2020 AAR WEBINAR SERIES -3 46

46

P-H Diagram NH3 System A on P-H Diagram

100kg/hr+36.5kg/hr 38.6kW 162.3kg/hr 25.8kg/hr 9 July 2020 AAR WEBINAR SERIES -3 47

47

P-H Diagram NH3 Screw Single Stage Te=-40 deg.C.

136.5kg/hr 100kg/hr+36.5kg/hr 38.6kW 9 July 2020 AAR WEBINAR SERIES -3 48

48

slide-9
SLIDE 9

7/10/20 9

Screw Single Stage Te=-40 deg.C. Economizer-Single stage liquid sub cooling

9 July 2020 AAR WEBINAR SERIES -3 49

49

System of Economizer

9 July 2020 AAR WEBINAR SERIES -3 50

50

P-H Diagram NH3 Single Stage Te=-40 deg.C. With Economizer

136.5kg/hr 100kg/hr+15kg/hr 38.6kW 20.5kg/hr 1 1 5 k g / h r 1 3 6 . 5 k g / h r 9 July 2020 AAR WEBINAR SERIES -3 51

51

Effect of Economizer

9 July 2020 AAR WEBINAR SERIES -3 52

52

Idea of System C

9 July 2020 AAR WEBINAR SERIES -3 53

53

P-H Diagram NH3

100kg/hr+12.8kg/hr 38.6kW 135.4kg/hr 22.6kg/hr 112.8kg/hr 135.4kg/hr

System C on P-H Diagram

9 July 2020 AAR WEBINAR SERIES -3 54

54

slide-10
SLIDE 10

7/10/20 10

Idea of System D

9 July 2020 AAR WEBINAR SERIES -3 55

55

P-H Diagram NH3

100kg/hr+15kg/hr 38.6kW 135.5kg/hr 20.5kg/hr 115 kg/hr 135.5kg/hr

System D on P-H Diagram

9 July 2020 AAR WEBINAR SERIES -3 56

56

Gas compression in kg/hr Booster High Stage Single Stage 136.5 System A 136.5 162.3 Single Stage with liquid cooler 115.0 136.5 System C 112.8 135.4 System D 115.0 135.5

Compression gas weight of each system

9 July 2020 AAR WEBINAR SERIES -3 57

57

The comparison of the previous sheet put the economizer and two stage on the same level. The above calculations do not take into the account the effect of gas cooling to the capacity of high stage. In two stages, the low stage discharge gas is cooled at intercooler and this enhance the capacity of high stage. This enable the lower intermediate pressure with the same set of the compressors.

9 July 2020 AAR WEBINAR SERIES -3 58

Efficiency of Two stage systems

58

Two Stage Refrigeration System

9 July 2020 AAR WEBINAR SERIES -3 59

59

Efficiency of Two stage system with various volume ratio (Screw)

9 July 2020 AAR WEBINAR SERIES -3 60

Te

  • 30
  • 35
  • 40
  • 45
  • 50
  • 55
  • 60

Volume ratio 1 0.54 0.40 1.19 1.01 0.80 0.61 0.46 1.49 1.91 1.64 1.37 1.12 0.90 0.69 0.52 1.95 2.04 1.74 1.52 1.27 1.03 0.81 0.61 2.31 2.09 1.81 1.57 1.33 1.09 0.87 0.66 2.91 2.08 1.82 1.57 1.36 1.14 0.92 0.72 3.79 1.82 1.60 1.38 1.19 0.99 0.81 4.55 1.73 1.56 1.36 1.17 1.00 0.84 5.69 1.45 1.30 1.13 0.97 0.85 Max 2.09 1.82 1.60 1.38 1.19 1.00 0.85 Min 1.91 1.64 1.37 1.01 0.80 0.54 0.40 9% 10% 14% 27% 33% 46% 53% Ratio 2.31 2.31 3.79 3.79 3.79 4.55 5.69 Ti 1.01

  • 4.42
  • 4.79
  • 10.7
  • 16.8
  • 14.1
  • 16.8

60

slide-11
SLIDE 11

7/10/20 11

Volume ratio Efficiency

Efficiency of Two stage system with various volume ratio (Screw)

9 July 2020 AAR WEBINAR SERIES -3 61 0.5 1 1.5 2 2.5 1 2 3 4 5 6

Efficency of various volume ratio

  • 3
  • 3

5

  • 4
  • 4

5

  • 5
  • 5

5

  • 6

61

Overall efficiency goes down as the temperature goes down. Effect of Volume ratio increases as the evaporative temperature goes down. Up to

  • 40 deg.C. the highest and lowest

efficiency has only 10 %, but at -60deg.C, there are more than 50% difference.

9 July 2020 AAR WEBINAR SERIES -3 62

Efficiency of Two stage system with various volume ratio (Screw)

62

From Te -30 to -40 deg.C. , selecting intermediate temperature of -5 deg.C. gives maximum performance. The common intercooler works good in this range. For the lower temperature separate intercoolers are required.

9 July 2020 AAR WEBINAR SERIES -3 63

Efficiency of Two stage system with various volume ratio (Screw)

63

The efficiency goes down as the evaporating temperature goes down. Between Te=-40deg.C. and Te=-60deg.C., the power consumption increases by 60%. The bottom line is, you must get 60% more yield or 60% higher price if you want to run the system at -60 deg.C.

9 July 2020 AAR WEBINAR SERIES -3 64

Efficiency of Two stage system with various volume ratio (Screw)

64

Volume ratio Efficiency

0.5 1 1.5 2 2.5 0.5 1 1.5 2 2.5 3 3.5 4 4.5

  • 3
  • 3

5

  • 4
  • 4

5

  • 5
  • 5

5

Efficiency of Two stage system with various volume ratio (Reciprocating)

9 July 2020 AAR WEBINAR SERIES -3 65

65

Effect of high compression ratio to the volumetric efficiency of reciprocating compressors.

9 July 2020 AAR WEBINAR SERIES -3 66

66

slide-12
SLIDE 12

7/10/20 12

Screw compressor ports

9 July 2020 AAR WEBINAR SERIES -3 67

67

Tc Tc=35d 35deg.C

Tc=45deg.C

Ad Adiabatic Compression Efficiency of Am Ammonia Compressors at volume ration 2.6 an and evap aporat ating temperat ature fixed at at -5 5 de deg.C.

(5) (3.8)

  • 5

14 27 37 45 52 58 63 68 73 77 81 85

Co Condensing temp

Screw compressor ports for high stage

9 July 2020 AAR WEBINAR SERIES -3 68

68

Te Te=-30d 30deg.C

Te=-45deg.C

Ad Adiabatic Compression Efficiency of Am Ammonia Compressors at volume ration 2.6 and and co condensing te temperatu ture fixed at t -5 5 de deg.C.

(5) (3.0)

  • 5
  • 22
  • 30
  • 36 -40
  • 44
  • 46
  • 49
  • 51
  • 52
  • 54
  • 55 -57 Ev

Evap aporat ating te temp

Screw compressor ports for low stage

9 July 2020 AAR WEBINAR SERIES -3 69

69

Role of selection of low pressure receiver is more significant for low temperature applications because.

  • 1. Any sizes of the vessels cannot completely

eliminate the liquid drop.

  • 2. Impact of liquid particle to the efficiency is

more significant in low temperature

  • At -5deg.C., the liquid expand to the gas with

233time volume.

  • At -40deg.C. 1071times.
  • At -60 deg.C. 3364 times

Significance of Selection of low pressure receivers

9 July 2020 AAR WEBINAR SERIES -3 70

70

  • You cannot

completely remove the liquid drops from the gas.

  • There are only

some guide lines. Selection Criteria

9 July 2020 AAR WEBINAR SERIES -3 71

71

The low pressure receiver liquid level changes during the defrost and change of freezing cycle. This is more significant in low temperature, and especially for the freezing applications. Sizes, designs and the decision of control and high level alarm for the low pressure receiver and surge drum should take this in consideration. At high level, the gas speed should not exceed the design.

9 July 2020 AAR WEBINAR SERIES -3 72

72

slide-13
SLIDE 13

7/10/20 13

9 July 2020 AAR WEBINAR SERIES -3 73

  • 4. Case Study

Cryogenic cooling

73

9 July 2020 AAR WEBINAR SERIES -3 74

Tc deg.C. Te deg.C. TR BkW High Stage 15

  • 40

64.9 100 Booster

  • 40
  • 60

39.2 42

Cryogenic cooling

74

9 July 2020 AAR WEBINAR SERIES -3 75

This customer was using N2 for the process cooling. Product temperature required is -40 deg.C. N2 are released in atmosphere at -30 to -80 deg.C. after the evaporation. This was changed by the closed circuit Ammonia refrigeration. Cryogenic cooling

75

9 July 2020 AAR WEBINAR SERIES -3 76

Original reactor limpet coil and jacket was used for the cooling. N2 temperature at 0 bar G is -195.8deg.C. It is replaced with Ammonia at -60 deg.C. with forced circulation of 6 times the evaporation. Cryogenic cooling

76

9 July 2020 AAR WEBINAR SERIES -3 77

77