
SLIDE 1
6/2/2020 1
Child Care Management Software
What you Need to Know and Why it Matters
Louise Stoney Sharon Easterling Opportunities Exchange
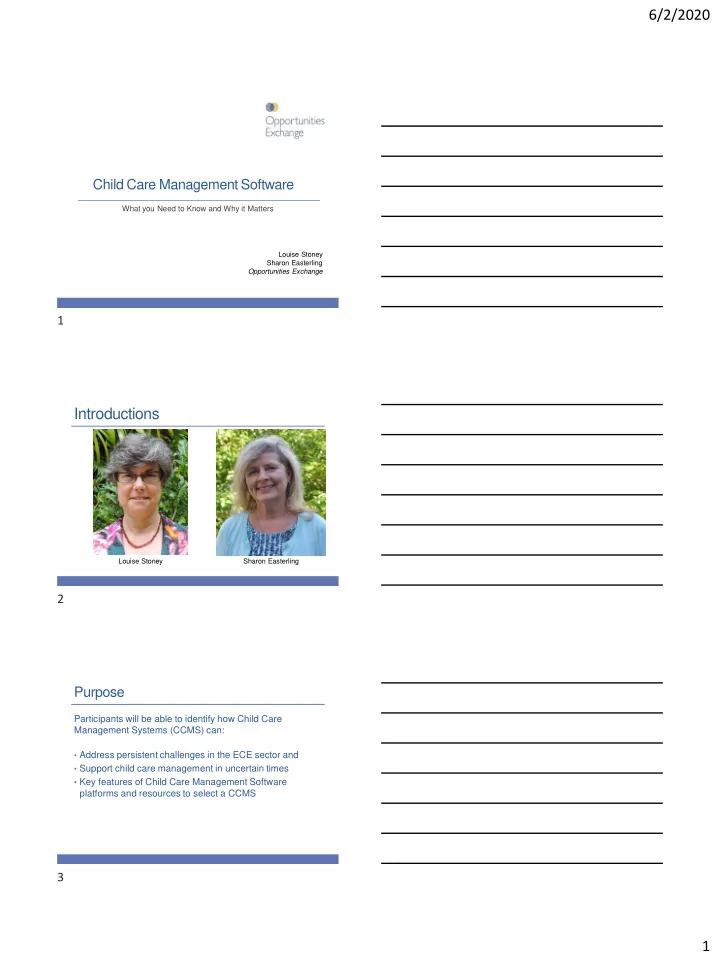
Introductions
Louise Stoney Sharon Easterling
Purpose
Participants will be able to identify how Child Care Management Systems (CCMS) can:
- Address persistent challenges in the ECE sector and
- Support child care management in uncertain times
- Key features of Child Care Management Software
platforms and resources to select a CCMS