
SLIDE 1
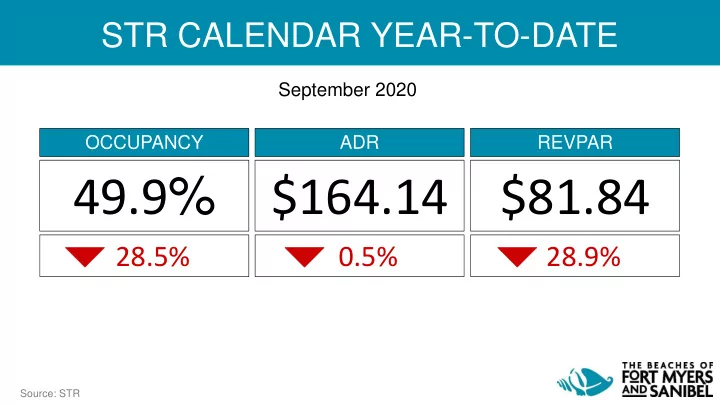
STR CALENDAR YEAR-TO-DATE
September 2020
49.9%
28.5%
OCCUPANCY
$164.14
0.5%
ADR
$81.84
28.9%
REVPAR
Source: STR
49.9 % $164.14 $81.84 28.5% 0.5% 28.9% Source: STR STR - - PowerPoint PPT Presentation
STR CALENDAR YEAR-TO-DATE September 2020 OCCUPANCY ADR REVPAR 49.9 % $164.14 $81.84 28.5% 0.5% 28.9% Source: STR STR CALENDAR YEAR-TO-DATE September 2020 OCCUPANCY ADR REVPAR 49.9% $164.14 $81.84 LEE 28.5% 0.5% 28.9% 48.7%
STR CALENDAR YEAR-TO-DATE
September 2020
28.5%
OCCUPANCY
0.5%
ADR
28.9%
REVPAR
Source: STR
STR CALENDAR YEAR-TO-DATE
September 2020
OCCUPANCY ADR REVPAR LEE
49.9% $164.14 $81.84
28.5% 0.5% 28.9% FL
48.7% $138.87 $67.67
33.4% 5.5% 37.1% US
44.8% $106.22 $47.59
33.6% 19.5% 46.6%
Source: STR
BED TAX FYTD
August 2020
Source: Lee County Clerk of Court
Source: Lee County Port Authority
RSW provides nonstop service to 49 destinations by 11 air carries. Nonstop service to Canada resumed on October 10!
Origin State Share Changes Over Time Mar 15 – Sep 30, 2020 v Mar 15 – Sep 30, 2019
0.0% 2.0% 4.0% 6.0% 8.0% 10.0% 12.0% 14.0% OH IL GA IN PA MI NC NY KY TNOut of State Trip Share Detail
2019 2020 46.6% 53.4% 67.1% 32.9% FL OOSTrip Share
2019 2020Trip Share up in-state, and from Ohio, Illinois, Georgia, and Indiana.
Origin State Share Changes Over Time Mar 15 – Sep 30, 2020 v Mar 15 – Sep 30, 2019
Atlanta gains share, while share down substantially for many Out of State DMAs.
DMA 2019 2020 (ranked for) % Change
Miami/Fort Laud. 14.4% 27.5% 90.9% Tampa/Saint Pete 16.4% 20.4% 24.4% West Palm Beach 5.7% 7.6% 33.7% Orlando/Daytona 6.2% 7.4% 19.4% Chicago 4.0% 2.5%
Atlanta 2.3% 2.3% 0.8% Fort Myers/Naples 1.0% 1.7% 62.9% JAX-Brunswick 1.4% 1.5% 9.9% New York 4.8% 1.4%
Indianapolis 1.6% 1.2%
0.0% 5.0% 10.0% 15.0% 20.0% 25.0% 30.0%
DMA (Shortened) Ranked for 2020
2019 2020
Length of Stay Shifts Over Time
Mar 15 – Sep 30, 2020 v Mar 15 – Sep 30, 2019 Average Length of Stay Nudges Upwards in All Categories.
4.3 3.1 5.0 4.5 3.8 5.7 0.0 1.0 2.0 3.0 4.0 5.0 6.0 Overall In - State Out of StateOvernight Trip Average Unique Days
2020 2019 Feel safe going to a beach
Source: DSG Consumer Sentiment Study Wave 6
Feel safe to vacation again
Source: DSG Consumer Sentiment Study Wave 6
Vacation planned for next 2 months
Source: DSG Consumer Sentiment Study Wave 6
STR PROJECTIONS
Lee County
OCCUPANCY ADR REVPAR 2020
50.6% $154.71 $78.28
26.5% 1.6% 27.7% 2021
62.2% $154.63 $96.15
22.9% 0.1% 22.8%
Source: STR