
SLIDE 1
Cochise County Recycling 8.5 Year Performance History
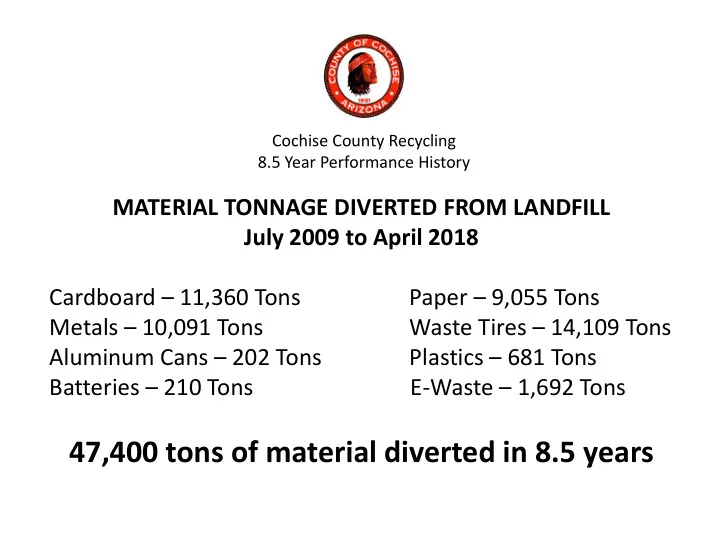
47,400 tons of material diverted in 8.5 years Volatility In The - - PowerPoint PPT Presentation
Cochise County Recycling 8.5 Year Performance History MATERIAL TONNAGE DIVERTED FROM LANDFILL July 2009 to April 2018 Cardboard 11,360 Tons Paper 9,055 Tons Metals 10,091 Tons Waste Tires 14,109 Tons Aluminum Cans 202
Cochise County Recycling 8.5 Year Performance History
$0.00 $10.00 $20.00 $30.00 $40.00 $50.00
Revenue per Ton For Single Stream Recycling Material
Volatility In The Market
Recycle Stream Audit Results
Paper 34.2% Cardboard 25% Scrap Metal .6% Tin 2.2% Aluminum Cans 1.3% #1 Plastic 4.7% #2 Plastic 2.3% #5 Plastic .3% Rigid Plastic .7% Glass 5.4% Trash/Residue 23.2%
% of Commodity Mix In Single Stream Recyclable Material
City Council Work Session May 1, 2018
– 5 year term, automatic 5 year renewal after 5 years, unless a member gives 180 day written notice
Fiscal Year Rate (per ton) Increase FY18 $ 64.00 0.00% FY17 $ 64.00 10.82% FY16 $ 57.75 5.00% FY15 $ 55.00 2.80% FY14 $ 53.50 2.88% FY13 $ 52.00 1.96% FY12 $ 51.00 2.00% FY11 $ 50.00 2.04% FY10 $ 49.00 2.62% FY09 $ 47.75
Landfill Rates under 2,000 pounds
Cochise County Transfer $ 64.00 $ 64.00 Glendale Glendale residents $ - $ 15.79 Avondale residents $ 26.00 $ 26.00 All others $ 32.25 $ 32.25 Flagstaff $ 44.42 $ 44.42 Gila County $ 39.41 $ 39.41 Salt River $ 39.00 $ 39.00 Tucson $ 32.00 $ 32.00 Pima County $ 45.00 $ 45.00
Municipality 2012 Monthly Residential Rate 2018 Monthly Residential Rate Percent Increase Sierra Vista $ 18.10 *$ 19.67 8.67% Avondale $ 20.00 $ 20.00 0.00% Buckeye $ 17.00 $ 21.44 26.12% Chandler $ 15.07 $ 16.93 12.34% El Mirage $ 12.25 $ 13.33 8.82% Glendale $ 16.30 $ 19.05 16.87% Goodyear $ 22.80 $ 22.80 0.00% Mesa $ 23.35 $ 28.76 23.18% Peoria $ 15.06 $ 13.60
Phoenix $ 15.96 $ 26.80 67.92% Tucson $ 16.75 $ 16.75 0.00% *Proposed rate for 2018. Current rate of $17.10 would be a 5.52%
Quarterly Bill Monthly Monthly Difference Annual Difference City 65 gallon $ 17.23 $ 2.25 $ 27.00 City 95 gallon $ 19.67 $ 2.57 $ 30.84 Customer A $ 90.00 $ 30.00 $ 12.90 $ 154.80 Customer B $ 135.00 $ 45.00 $ 27.90 $ 334.80 Customer C $ 137.50 $ 45.83 $ 28.73 $ 344.76 Customer D $ 145.00 $ 48.33 $ 31.23 $ 374.76
City Council Work Session May 1, 2018
Waste Management - April 23, 2018
Aluminum & Metal Cans 3.5 % Corrugated Cardboard 25.0 % 1 & 2 Plastics 8.0 % Fiber 34.3 %
Operational Impact Cons Pros
Minimal customer re-education Recycling service retained No additional routes added The reduction in acceptable recyclables will increase the quantity
customers to require larger or additional trash containers Customers that require larger or additional trash cans would incur higher fees for services Worse levels of contamination possible if people do not choose to use larger
Operational Impact Cons Pros
Little to no impact; one or two routes per month would change from recycling to refuse Current set out rate for recycling is 51% Retains recycling collection service Might reduce some costs at the transfer station Schedule may be challenging for customers to follow
Operational Impact Cons Pros
Would require two additional collection days per month, increasing system costs Current set out rate for recycling is 51% Retains recycling collection service Schedule may be challenging for customers to follow Would reduce the number of special pickup days