
SLIDE 1
This translation is to be used solely as a reference and the consolidated financial statements in this release are unaudited.
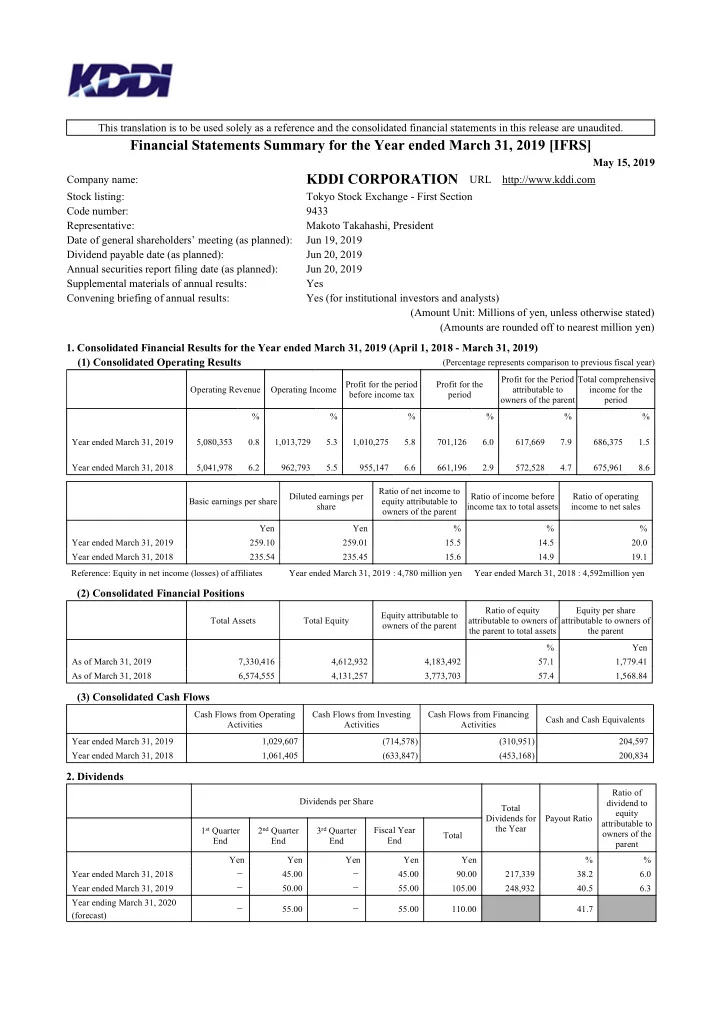
Financial Statements Summary for the Year ended March 31, 2019 [IFRS]
May 15, 2019 Company name:
KDDI CORPORATION URL http://www.kddi.com
Stock listing: Tokyo Stock Exchange - First Section Code number: 9433 Representative: Makoto Takahashi, President Date of general shareholders’ meeting (as planned): Jun 19, 2019 Dividend payable date (as planned): Jun 20, 2019 Annual securities report filing date (as planned): Jun 20, 2019 Supplemental materials of annual results: Yes Convening briefing of annual results: Yes (for institutional investors and analysts) (Amount Unit: Millions of yen, unless otherwise stated) (Amounts are rounded off to nearest million yen)
- 1. Consolidated Financial Results for the Year ended March 31, 2019 (April 1, 2018 - March 31, 2019)
(1) Consolidated Operating Results
(Percentage represents comparison to previous fiscal year) Operating Revenue Operating Income Profit for the period before income tax Profit for the period Profit for the Period attributable to
- wners of the parent
Total comprehensive income for the period % % % % % % Year ended March 31, 2019 5,080,353 0.8 1,013,729 5.3 1,010,275 5.8 701,126 6.0 617,669 7.9 686,375 1.5 Year ended March 31, 2018 5,041,978 6.2 962,793 5.5 955,147 6.6 661,196 2.9 572,528 4.7 675,961 8.6 Basic earnings per share Diluted earnings per share Ratio of net income to equity attributable to
- wners of the parent
Ratio of income before income tax to total assets Ratio of operating income to net sales Yen Yen % % % Year ended March 31, 2019 259.10 259.01 15.5 14.5 20.0 Year ended March 31, 2018 235.54 235.45 15.6 14.9 19.1 Reference: Equity in net income (losses) of affiliates Year ended March 31, 2019 : 4,780 million yen Year ended March 31, 2018 : 4,592million yen
(2) Consolidated Financial Positions
Total Assets Total Equity Equity attributable to
- wners of the parent
Ratio of equity attributable to owners of the parent to total assets Equity per share attributable to owners of the parent % Yen As of March 31, 2019 7,330,416 4,612,932 4,183,492 57.1 1,779.41 As of March 31, 2018 6,574,555 4,131,257 3,773,703 57.4 1,568.84
(3) Consolidated Cash Flows
Cash Flows from Operating Activities Cash Flows from Investing Activities Cash Flows from Financing Activities Cash and Cash Equivalents Year ended March 31, 2019 1,029,607 (714,578) (310,951) 204,597 Year ended March 31, 2018 1,061,405 (633,847) (453,168) 200,834
- 2. Dividends
Dividends per Share Total Dividends for the Year Payout Ratio Ratio of dividend to equity attributable to
- wners of the