3/15/2010 Module 3 Lesson Title Approximate Developing Timing - - PDF document

3 15 2010
SMART_READER_LITE
LIVE PREVIEW

3/15/2010 Module 3 Lesson Title Approximate Developing Timing - - PDF document

3/15/2010 Module 3 Lesson Title Approximate Developing Timing Plans for Efficient Intersection Time (minutes) Operations During Moderate Traffic Volume 1 Determining the effect of minor street 30 Vehicle Extension time on intersection


slide-1
SLIDE 1

3/15/2010 1

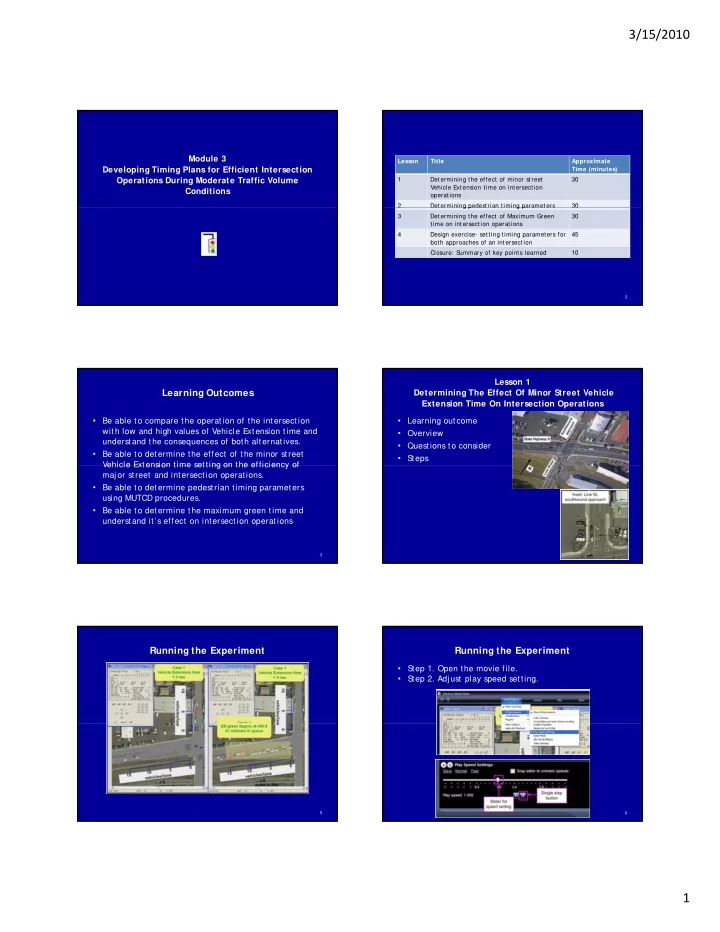
Module 3 Developing Timing Plans for Efficient Intersection Operations During Moderate Traffic Volume Conditions

Lesson Title Approximate Time (minutes) 1 Determining the effect of minor street Vehicle Extension time on intersection

  • perations

30 2 Determining pedestrian timing parameters 30

2

g p g p 3 Determining the effect of Maximum Green time on intersection operations 30 4 Design exercise- setting timing parameters for both approaches of an intersection 45 Closure: S ummary of key points learned 10

Learning Outcomes

  • Be able to compare the operation of the intersection

with low and high values of Vehicle Extension time and understand the consequences of both alternatives.

  • Be able to determine the effect of the minor street

Vehicle Extension time setting on the efficiency of Vehicle Extension time setting on the efficiency of maj or street and intersection operations.

  • Be able to determine pedestrian timing parameters

using MUTCD procedures.

  • Be able to determine the maximum green time and

understand it’s effect on intersection operations

3

Lesson 1 Determining The Effect Of Minor Street Vehicle Extension Time On Intersection Operations

  • Learning outcome
  • Overview
  • Questions to consider
  • S

teps

4

Running the Experiment

5

Running the Experiment

  • S

tep 1. Open the movie file.

  • S

tep 2. Adj ust play speed setting.

6

slide-2
SLIDE 2

3/15/2010 2

Considering the Questions

  • How do the EB and S

B approach queue lengths vary given the two Vehicle Extension time values used for the S B approach?

  • How does an increase in the S

B approach Vehicle Extension affect the EB green interval duration? Extension affect the EB green interval duration?

  • How does the increase in the S

B approach Vehicle Extension affect the cycle length?

  • What effect does the Vehicle Extension time have on

the delay experienced for these two cases?

7

Data Collection Table for queue and display status for Case 1

8

Data Collection Table for queue and display status for Case 2

9

Data Summary

SB Approach EB Approach

10

Mean Values for Case 1 and Case 2

11

Question 1

  • How do the EB and S

B approach queue lengths vary given the two Vehicle Extension time values used for the S B approach?

12

slide-3
SLIDE 3

3/15/2010 3

Queue lengths for SB approach

13

Queue Lengths for EB approach

14

Question 2

  • How does an increase in the S

B approach Vehicle Extension affect the EB green interval duration?

15

Question 3

  • How does the increase in the S

B approach Vehicle Extension affect the cycle length?

16

Question 4

  • What effect does the Vehicle Extension time have on

the delay experienced for these two cases?

17

Delay for SB approach

18

slide-4
SLIDE 4

3/15/2010 4

Delay for EB approach

19

Total delay estimation for SB and EB approaches

20

Average delay for SB and EB approaches

21

Highway Capacity Manual Equation

22

Queue length vs. Time for cases 1 and 2

23

Delay for cases 1 and 2

24

slide-5
SLIDE 5

3/15/2010 5

Lesson 2 Determining Pedestrian Timing Parameters

  • Learning outcome
  • Overview
  • Questions to consider
  • S

teps

25

Running the Experiment

  • S

tep 1. Compute the pedest rian clearance interval.

  • S

tep 2. S tart the MOS T software tool and open the input file.

  • S

tep 3. Enter the pedest rian timing parameters. S t 4 Ob th d t i d hi l ti i

  • S

tep 4. Observe the pedestrian and vehicle timing processes for one green interval.

  • S

tep 5. Observe the S B approach (phase 4) for two green intervals.

26

Considering the Questions

  • What duration of the pedestrian clearance interval do

you recommend?

  • What are the components of the pedestrian timing

process and how do they relate to the concurrent vehicle timing process components vehicle timing process components.

  • What effect do the pedestrian timing parameters have
  • n the duration of the green indication?

27

Question 1

  • What duration of the pedestrian clearance interval do

you recommend?

28

Question 1

  • What duration of the pedestrian clearance interval do

you recommend?

29

Question 2

  • What are the components of the pedestrian timing

process and how do they relate to the concurrent vehicle timing process components.

30

slide-6
SLIDE 6

3/15/2010 6

Question 2

31

T = 14.4 T = 19.4

Question 2

32

Question 3

  • What effect do the pedestrian timing parameters have
  • n the duration of the green indication?

33

Question 3

  • What effect do the pedestrian timing parameters have
  • n the duration of the green indication?

34

Lesson 3 Determining The Effect Of Maximum Green Time On Intersection Operations

  • Learning outcome
  • Overview
  • Questions to consider
  • S

teps

35

Running the Experiment

  • S

tep 1. Open the movie file

  • S

tep 2. Observe the operation of case 1 and record your

  • bservations.
  • S

tep 3. Observe the operation of case 2 and record your

  • bservations

36

  • bservations.
  • S

tep 4. Identify the pros and cons of the two different maximum green time settings on the westbound approach and on the overall performance of the intersection.

slide-7
SLIDE 7

3/15/2010 7

Considering the Questions

  • Are all of the vehicles in the initial queue on the EB

approach served before the end of each green interval?

  • What is the mechanism for termination of the phase

serving the westbound approach?

  • What are the advantages and disadvantages of the 40

g g second maximum green time for the operation of case 1?

  • What are the advantages and disadvantages of the 60

second maximum green time for the operation of case 2?

  • Which maximum green time setting would you select

and why?

37

Data Collected Green Interval Durations for case 1 and 2

38

Variation of Green Time with Maximum Green

60 80

duration, sec

39 20 40 20 40 60 80

Green interval d Maximum green, sec

Variation of Delay with Maximum Green

30 40

c/veh

40 10 20 20 40 60 80

Delay, sec Maximum green, sec

Question 1

  • Are all of the vehicles in the initial queue on the EB

approach served before the end of each green interval?

41

Question 1

42

slide-8
SLIDE 8

3/15/2010 8

Question 2

  • What is the mechanism for termination of the phase

serving the westbound approach?

43

Question 3

  • What are the advantages and disadvantages of the 40

second maximum green time for the operation of case 1?

44

Question 4

  • What are the advantages and disadvantages of the 60

second maximum green time for the operation of case 2?

45

Question 5

  • Which maximum green time setting would you select

and why?

46

Lesson 4 Design Exercise- Setting Timing Parameters For Both Approaches Of An Intersection

  • Learning outcome
  • Overview
  • Questions to consider
  • S

teps S teps

47

Running the Experiment

  • S

tep 1. S tart the MOS T software tool and open the input file.

  • S

tep 2. Observe the simulation of both intersection approaches using the given values of Minimum Green time and Vehicle Extension time

48

time and Vehicle Extension time.

  • S

tep 3. Experiment with the Minimum Green time setting for phases 2 and 4.

  • S

tep 4. Experiment with the Vehicle Extension time setting for phases 2 and 4.

slide-9
SLIDE 9

3/15/2010 9

Running the Experiment

  • S

tep 5. Experiment with the Maximum Green time setting for phases 2 and 4.

  • S

tep 6. Continue to experiment with the values of these three timing parameters until you reasonably meet the criteria listed below

49

meet the criteria listed below.

  • S

tep 7. Prepare a j ustification of your recommended parameters.

Considering the Questions

  • What are the indicators of inefficient intersection
  • perations?

What are the indicators of efficient

  • perations?
  • Based on your observations of the conditions for this

experiment what specific changes would you make to experiment, what specific changes would you make to the given signal timing settings?

  • After implementing these changes, did you meet the

criteria established in S ection 6.2?

50

Question 1

  • What are the indicators of inefficient intersection
  • perations?

What are the indicators of efficient

  • perations?

51

Question 2

  • Based on your observations of the conditions for this

experiment, what specific changes would you make to the given signal timing settings?

52

Question 2

53

Question 2

54

slide-10
SLIDE 10

3/15/2010 10

Question 2

55

Question 3

  • After implementing these changes, did you meet the

criteria established in S ection 6.2?

56

Closure: Summary Of Key Points Learned

  • Be able to compare operation of intersection with low

and high values of Vehicle Extension time and understand consequences of both alternatives.

  • Be able to determine effect of minor street Vehicle

Extension time setting on efficiency of maj or street and intersection operations. B bl d i d i i i

  • Be able to determine pedestrian timing parameters

using Manual of Uniform Traffic Control Devices (MUTCD) procedures.

  • Be able to determine Maximum Green time and

understand effect on intersection operations.

  • Be able to set timing parameters (Minimum Green time,

Vehicle Extension time, and Maximum Green time) for both approaches of intersection.

57