SLIDE 34 33
The GPT Group 2020 Interim Result | 10 August 2020
- 80%
- 70%
- 60%
- 50%
- 40%
- 30%
- 20%
- 10%
0% 10% Jan-20 Feb-20 Mar-20 Apr-20 May-20 Jun-20
Centre Sales growth (%) Spec/Mini Majors growth (%) Traffic growth (%) Traffic growth - ex Melb Central (%)
0% 2% 4% 6% 8% 10% 12% 0% 5% 10% 15% 20% 25% Jan-20 Feb-20 Mar-20 Apr-20 May-20 Jun-20 Portfolio online leakage (%) - LHS Portfolio market share (%) - RHS
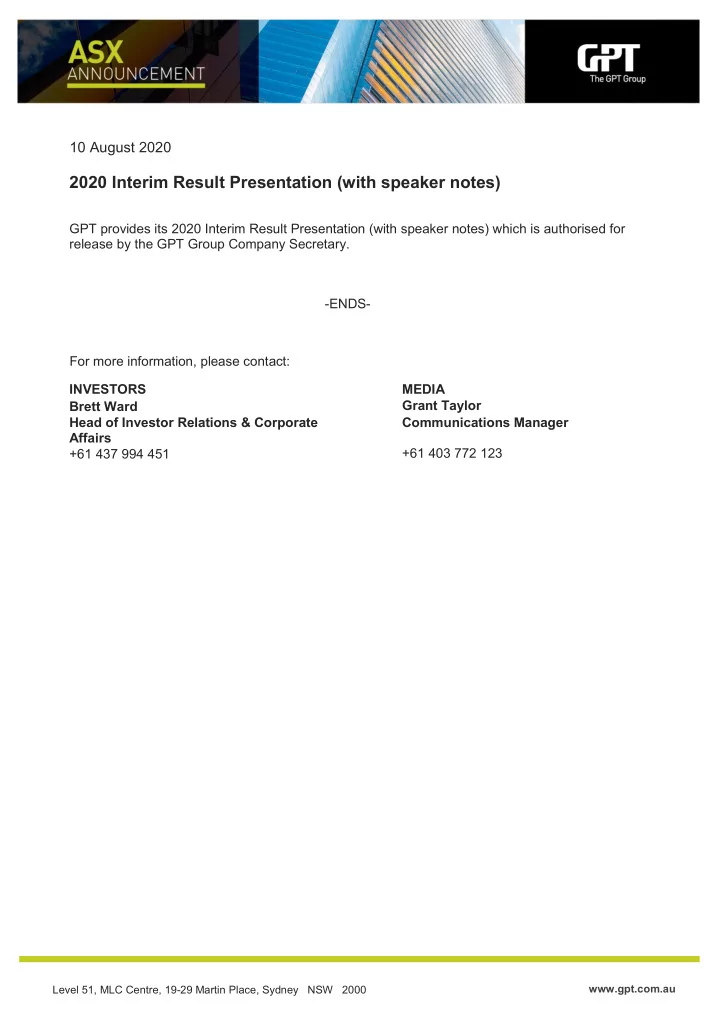
Portfolio Performance
Retail Sales and Traffic
+
Heavily impacted from mid March through to May with government restrictions introduced
+
Recovery evident from May in line with relaxation of restrictions MAT at 30 June 2020:
+
Centre Sales down 10% and Total Specialty Sales down 11% Categories that have performed well despite conditions:
+
Supermarkets up 1.2%; Discount Department Stores up 0.3%
+
Technology, Food Retail and General Retail, on average down 2.7% Categories impacted by government restrictions include:
+
Cinemas, Dining and Retail Services, average decline of 16.9%
Government measures implemented Peak COVID-19 related impacts
Market Share (Physical vs Online)
+
Government restrictions led to significant store closures and a corresponding shift to online retail purchasing
+
Omni-channel retailers benefited most from this shift
+
The result was a loss in market share across the portfolio, with sales diverting to online and smaller local centres out-performing as shoppers sought to limit travel movements
+
Since late April, there has been a rebound as shoppers begin to return to established shopping behaviours
Apr-20 Mar-20
Data: Based on weighted portfolio Source: Quantium
Whilst we had positive sales growth in January and February earlier this year, the graph demonstrates the sales and traffic trend for the 6 months and clearly shows the decline through the peak period of the restrictions. Importantly, by June, there had been a corresponding recovery across most retail categories with more stores re-opening and traffic returning. On Centre sales, for the 12 months to June our MAT was down 10%. At an asset level, as you would expect due to Melbourne Central’s location, it has experienced our strongest sales decline, down 18% for the 12 months, given the reductions of workers, students and tourists visiting the
- CBD. To our other assets, both Highpoint and Charlestown also were impacted with sales declines, with both
MAT’s down 12.5%. Conversely, Rouse Hill, was broadly flat on a MAT basis. On retail categories, whilst the major department stores experienced a decline in sales, catering to the more essential goods, both Kmart and Big W traded well over the period. Our Cinemas have been heavily impacted given the government restrictions and lack of product, with their MAT down almost 33% Supermarkets, not surprisingly traded well for the 12 months, benefiting from peak periods of substantial sales growth during March through to May, particularly with the initial panic buying. As a large number of Specialty stores hibernated during April and May, our Combined Specialty MAT was down 11.0%. Some retailers have performed well, those providing essentials like fresh food, or goods in demand given the people were spending more time at home, such as Rebel Sport and JB-Hi-Fi. Understandably, other retail categories have experienced sales declines, including Travel, Dining, Fashion and Footwear given the widespread store closures through the peak restriction period. If we then look at market share, which is a measure of the percentage of sales that we capture in our trade areas, through the period we saw customers limit out of home travel and reduce visitations to our retail assets. Online retail platforms benefited from this during March through to April. Encouragingly, we have seen over more recent months customers returning to their previous shopping behaviours, and our portfolio is reclaiming the lost sales to online. Market shares for both physical stores and
- nline are trending back to similar levels prior to the restrictions.
33