
SLIDE 1
The University of Southern Mississippi
School of Ocean Science and Engineering
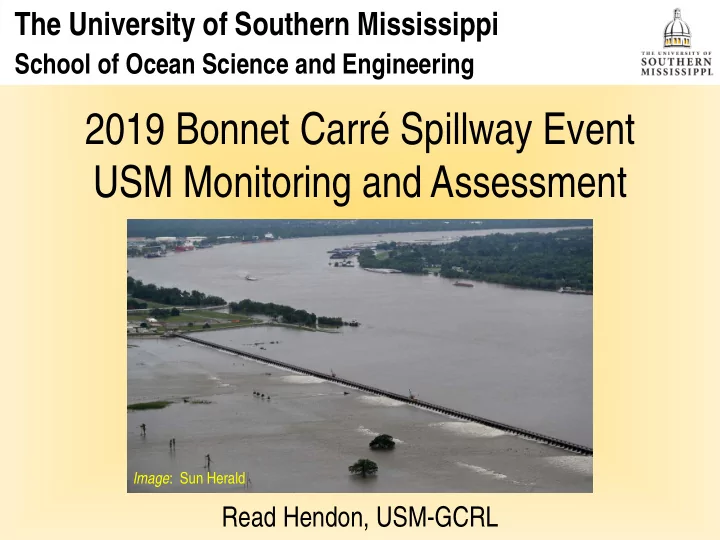
2019 Bonnet Carré Spillway Event USM Monitoring and Assessment
Image: Sun Herald
2019 Bonnet Carr Spillway Event USM Monitoring and Assessment Image - - PowerPoint PPT Presentation
The University of Southern Mississippi School of Ocean Science and Engineering 2019 Bonnet Carr Spillway Event USM Monitoring and Assessment Image : Sun Herald Read Hendon, USM-GCRL Bonnet Carr Spillway General purpose is to reduce
Image: Sun Herald
Source: http://www.mvn.usace.army.mil/Missions/Mississippi-River-Flood-Control/Bonnet-Carre-Spillway-Overview/Spillway-Operation-Information/
25 50 75 100 125 1937 1945 1950 1973 1975 1979 1983 1997 2008 2011 2016 2018 2019 Number of Days Open Year of Opening
Days Open - 1st Opening Days Open - 2nd Opening
First 70 Years = 8 Openings Past 12 Years = 6 Openings
Data Source: http://www.mvn.usace.army.mil/Missions/Mississippi-River-Flood-Control/Bonnet-Carre-Spillway-Overview/Spillway-Operation-Information/
Water Quality Remote Sensing and Modeling Oyster Spat Settlement
Depiction of surface salinity levels in the Mississippi Sound for July 17 (top) and August 22 (bottom), as extrapolated from field data at expanded water quality stations (yellow squares).
Complete closure of spillway = July 27
BILOXI GULFPORT BAY ST. LOUS OCEAN SPRINGS PASCAGOULA BILOXI GULFPORT BAY ST. LOUS OCEAN SPRINGS PASCAGOULA
Depiction of bottom salinity levels in the Mississippi Sound for July 17 (top) and August 22 (bottom), as extrapolated from field data at expanded water quality stations (yellow squares).
Complete closure of spillway = July 27
BILOXI GULFPORT BAY ST. LOUS OCEAN SPRINGS PASCAGOULA BILOXI GULFPORT BAY ST. LOUS OCEAN SPRINGS PASCAGOULA
Preliminary results from July 25 (left) and August 13-14 (right) sampling to determine sources of freshwater in the Mississippi Sound, based on isotopic signatures.
25 July 2019 13-14 August 2019
% MR in Total % MR in FW
Complete closure of spillway = July 27
Warmer colors (yellow to red) represent higher salinity waters typically observed in the region, while cooler colors (blue) are representative of lower salinity waters.
Regional surface salinity model output for July 16 (left) and August 15 (below).
Complete closure of spillway = July 27
matter in the water column